Profit-Targeting Forex Trades
Many traders constantly focus on money management and stop loss points in Forex trading. While knowing where to close losing trades is vital, knowing where to take winners off the table is just as crucial to long-term profitability as well.
Amazingly, we often associate trading stress with losing positions; however, our winners can cause just as much turmoil. Fact is, many traders let winners turn into losers, because they do not know when to close out their profitable positions. What’s more, some traders never “turn the corner” to hefty profitability, because they constantly swipe itty gains off the table, every time a trade works in their favor. The problem is that doing so will eventually lead to a negative P&L, when a large loser ensues.
I’ve never met a trader who hasn’t (at one time, or another) let a loser ride too long, because when the trade went against them, their emotions took control, causing them to hold. It’s just part of the learning curve. Moreover, when our trading history looks like “little win, little win, little win, big loser”, our P&L’s will not be pretty. Thus, to be as profitable as we can be, we need to attempt to reverse the aforementioned to “little loss, little loss, little loss, massive win.” By doing so, we will not only find ourselves profitable, but may also avoid blowing up our accounts as well. Thus, in this article, we will look at two strategies for profit targeting and one strategy that could help us hold our winners.
Section #1: Profit Targeting Strategies
Fibonacci Extensions
As we have covered in previous articles on TradingMarkets.com, Fibonacci numbers are based on naturally occurring sequences in nature. For more information on what Fibonacci numbers are and how they are derived, please view my recent article: How to Profit from Fibonacci Retracements in Forex.
While Fibonacci numbers are often thought of in terms of retracements, we can also use the same concepts in projecting where our winning trades will go.
As a lose definition, extensions are calculated by measuring the vertical distance of a recent move, and then multiplying the number by 61.8%, 1 and 1.618. Traders who believe an extended move will ensue often also use 2.618 and 4.236, though we will not use these numbers here.
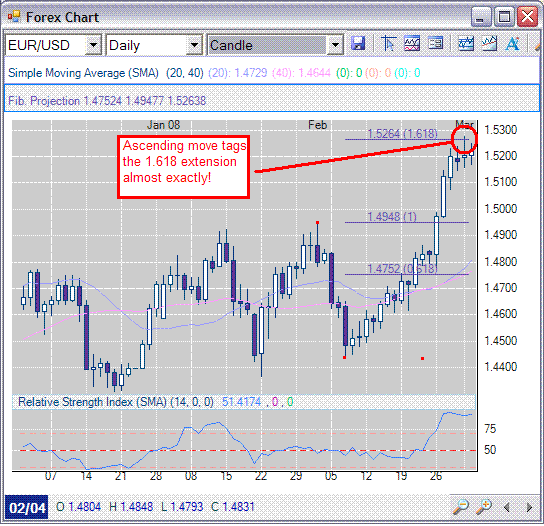
To calculate Fibonacci Extensions by hand, a trader would simply subtract a move’s high and low (shown on the below chart as 1.4948 and 1.444 respectively) and then multiply each by 61.8, 1 and 1.618. Really then what we’re left with are one key retracement level and two targets once the 61.8 mark is breached. More often than not, once the 61.8 level is breached, a move will likely retrace the full move. What’s more, should the pair move beyond full retracement, traders will likely then use the aforementioned level as support (or resistance in a declining move) for the new move.

As the above chart shows, when the 61.8% area was breached (with a close above, swing traders could have taken positions seeking and extended move into 1.4948, otherwise known as “full retracement.” Moreover, because the daily chart subsequently closed above full retracement, traders could have used the 1.4948 as a stop benchmark for an extended hold. (However, stops probably should have been placed slightly lower, at least in the 1.4943 area, keeping bid/ask spreads in mind.) Regardless, the EUR/USD immediately took off on the daily chart, eventually tagging the 1.618 extension almost exactly, before slowing down. Traders who held all the way up, would probably want to sell half of their position at this point, so as to not give back too much, if the pair were to reverse. For more information about how to potentially hold through a consolidation phase, please see Section #2 below.
It’s important to note that Fibonacci Extensions never mean an extended move will always unfold. What’s more, it’s important to take note of other indicators, economic events and currency and political news as well. If at anytime a trade looks like it is going to reverse, traders can always take half off the table, thus booking some profit, while also clearing their head of stress. Whenever possible though, we do want to attempt to hold for larger moves.
Andrew’s Pitchforks
Pitchforks are great trend projection and trading tools, often missed by many traders. Here we will look at how pitchforks can help project where we should take money off the table, should a winning trade ensue.
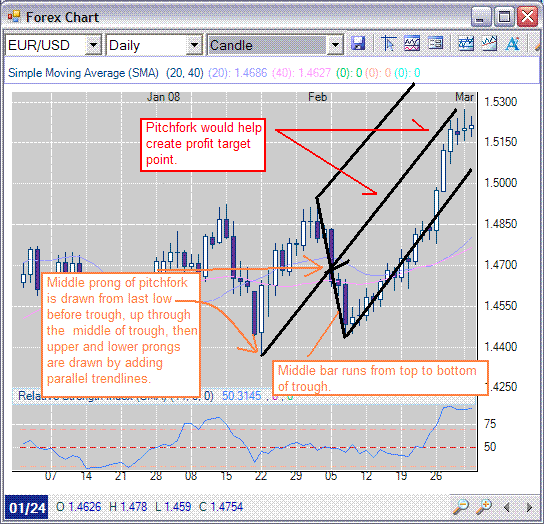
Without going into too much detail, pitchforks are basically drawn on a chart by dissecting a rally or trough, and then drawing a trendline from the highest, or lowest point, just prior to the rally, or trough through the middle point of the rally, or trough. (It sounds more confusing than it is.) Once, the middle line is drawn (the middle prong in the pitchfork), parallel lines above and below the middle prong, giving us the upper and lower prongs of the pitchfork. As a picture is worth a thousand words, please take a moment to look at the below chart for an example.

As the above chart shows in orange, the pitchfork formed by drawing a trendline from the last low before the trough, up through the middle point of the trough. Then, the upper and lower pitchfork prongs are drawn by adding parallel lines from the high and low of the trough. (In the case of a descending currency, the pitchfork would be created by using the last rally before the present decline.)
Moving into how pitchforks can help us find profit targets, we must remember that with this strategy, we will not focus on a particular/specific “number.” Instead, the pitchfork is a trend projection tool that will assist in guidance, though we must remain dynamic as a pair moves within it.
As the chart shows, traders who took long positions in the last ascending trend could have used the pitchfork as a trend projection tool. Generally, when trading on the long side, when a currency moves off a lower prong, traders could attempt to hold the position until the middle prong is touched. At this point it would be a good idea to take at least, if not all, of the trade off the table. What the pitchfork does not account for is a reversal of the trend, unless the lower prong (in this case) is significantly breached. For more guidance on how to hold winning positions, please see Section #2.
Pitchforks work in both up and down trends; thus, though the information above relates to a long-position, traders can simply invert the pitchfork in the case of short positions.
Finally, its important to note that where the middle prong was finally touched, is almost exactly at the 1.618 Fibonacci Extension point. It’s amazing how these things line up! Traders who prefer more information, than less, can overlay Fibonacci Extensions and pitchforks, thus finding a point where both meet up. Call it “twice the projection power”, if you will.
Section 2: Holding Winners
Using Candlesticks for Profits
Once in a while, I see something on a trading floor that’s so immensely simple, and yet, incredibly profitable. Just a few years after college, I was trading on a floor in Denver, when I stumbled upon one of the most incredible momentum traders I’ve ever met, Adam Johnson. I watched him book $250k in just over a month, trading nothing but breakouts. Of course, I took notes.
One of Johnson’s strategies for holding winners still sticks with me today, and I often use it in scenarios where I feel I could become emotional about a trade. The strategy is simple: Use candlesticks to determine where you close a trade.
There are a few variations and I’ll cover two here; however, at some point the strategy also requires a slight bit of instinct and intuition as well, something that often can only be learned through experience. Regardless of your experience level, candlesticks can be a great way to hold winners when our emotions are tugging at our trigger fingers.
The basic principal behind both styles is simply to look for higher lows within a breakout and lower highs in a breakdown. I’ll demonstrate on a chart in just a moment. I want to point out though that using candlesticks is more of a momentum strategy and will generally not work well in lateral markets. However, if you are trading a reversal, breakout, or breakdown, the strategy works well.
The first strategy is to first determine what timeframe you are most comfortable trading. For swing traders they might be daily and 4-hour charts. For daytraders, perhaps it would be 2-hour and 30-minute chart. FYI, for more of an explanation on how to drill down into charts for entry points please read my recent article: 6 Charts Every Forex Daytrader Should Watch.
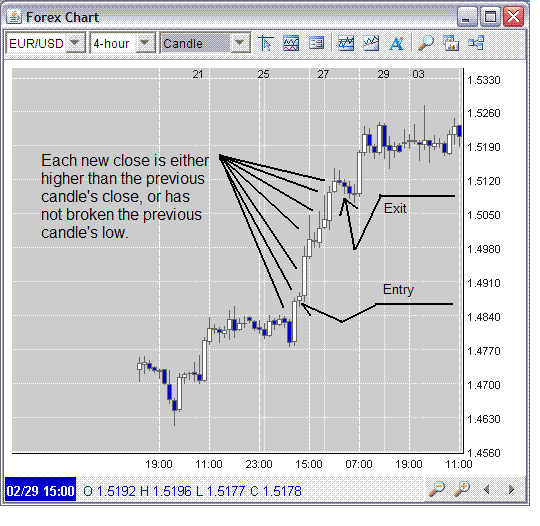
Once you know what charts you prefer to trade with, there will come a time when you catch the wave of momentum. And the overall strategy is this: Do not close your winning trade until the current candle breaks, or closes below the previous candle’s low. Take a look at the below chart.

What we see on the above 4-hour chart is recently, the EUR/USD staged a bold breakout in the 1.50 area. Traders using the simple strategy of not closing long positions until a candle broke the previous candle’s low, could have potentially held the momentum trade for upwards of 75 PIPs, a great trade by most standards. You may notice that about half way up the move, there was a point where momentum slowed slightly, where a ‘doji’ was created. The following candle traded just a few PIPs below the doji, before resuming the uptrend. The point is that by requiring a close below the previous candle’s low, we would have not been shaken out of the trade when momentum staggered.
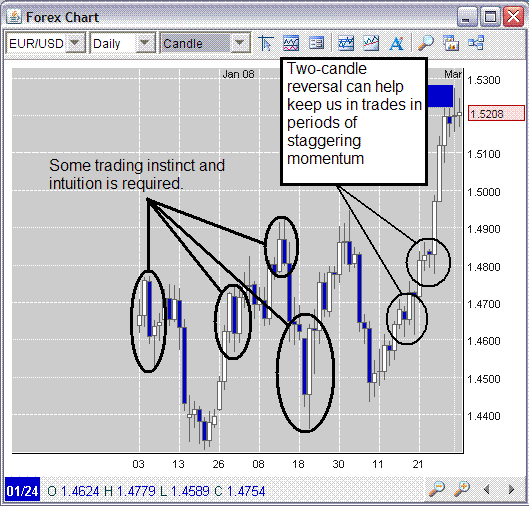
There are a couple of pitfalls to this strategy, however, with a little insight, they are easily over come. First and foremost, sometimes after a breakout, several candles can wane slightly, before the momentum picks up again. And, if we’re only looking at the previous candle, we can be wiggled out of our position, if a close below the previous low ensues. However, if we force a close below the previous candle two, or three candles ago, our chances of holding the trade longer are greater. What is crucial to understand though, is that looking two, or three candles back can increase our chances of seeing the entire trade reverse directions, especially if the last candle was a big one. To overcome this, it is important to only look two, or three candles back if the present candle is a short consolidation candle, like a doji. We should never look back several candles, if the previous candle was a large breakout, or breakout candle. The below chart shows where using the two-candle reversal would have keep us in the trade. It also shows where waiting for a reversal on a large breakout candle would have caused us to give back all of our profits and even lose some money in several cases.

As the above chart shows, in several instances, a move was entirely retraced and would have caused a loss, if traders had held based on the low (or high) of the two-candle strategy. To further combat this issue, trades must drill down into timeframes after a large breakout, while also looking at Fibonacci retracements, moving averages, support and resistance and indicators like MACD and stochastics. What’s more, if while in a trade, some sort of news breaks that infers slowing momentum, the best bet is to just get out and live to trade another day.
While using previous candles to hold a winner is a great (and simple) strategy, it does not allow us to credulously ignore other events happening in the market, or within our trade.
Exit is everything.
Mark Whistler is the founder of WallStreetRockStar.com and is the author of multiple books on trading.
Mark’s newest book, The Swing Trader’s Bible (John Wiley & Sons, Inc.) – co-authored with CNBC/Fox News regular guest Matt McCall – will be on shelves in late summer, 2008. In addition, Mark also writes regularly for TraderDaily.com and Investopedia.com.
