Applying Fibonacci to the Market
The dimensional properties of Fibonacci Series, introduced to the West by the 12th century mathematician Leonardo Pisano, aka “Fibonacci”, offers a popular tool to contemporary traders and market analysts. In the first installment of this three part series on Fibonacci I acquainted you with the development and key characteristics of Fibonacci series.
Click here to order your copy of The VXX Trend Following Strategy today and be one of the very first traders to utilize these unique strategies. This guidebook will make you a better, more powerful trader.
In this second installment of this educational series I will begin to explore the practical applications of utilizing Fibonacci levels while trading. In it, I will teach you not only how to draw Fibonacci grids correctly, but also how to read the projected price levels. This goes beyond simply identifying the actual price, to tools for taking a position based upon those price zones.
When it comes to the market, the ratios derived from Fibonacci offer highly accurate readings to help identify key turning points in price activity. The most popular levels created by these ratios, when translated into percentage levels, include 138.2%, 100%, 61.8%, 50%, 38.2%, 0%, and -38.2%. To apply these levels to a price move in the market or in a particular security, a trader must be able to understand several things. First s/he must understand the significance of these levels and what they mean. Second, s/he must be able to draw them correctly in order to view accurate projections of these levels.
Understanding the significance of Fibonacci levels in terms of its relationship to price action is not merely an understanding of nature. Fibonacci series gained popularity due to the wide-held belief that nature is predictable and patterns and manifestations of development can be categorically studied and understood. Since human beings are subject to these same laws of development, the belief holds that a crowd’s mentality may also be understood and plotted accordingly. This led to the application of Fibonacci levels to the marketplace as a way to identify key turning points, or support or resistance zones, within a security.
Originally these levels were the focus of futures traders, but as real-time charting platform capabilities improved over the course of this past decade, it has opened the door to allow the average market participant to also be able to apply these tools. In this regard, Fibonacci levels have also become somewhat self-fulfilling, as is the case of many of the most popular forms of support and resistance. In most cases, this serves to strengthen these levels and provides more accurate price points.
Before a trader can really apply Fibonacci levels successfully, however, s/he must first have a strong grasp upon what exactly is meant by “support and resistance levels.” In an earlier article, I explored in great detail the concept of support and resistance levels as they relate to price. To summarize, support and resistance levels are key price zones whereby a current directional move in a security is likely to stall or reverse. Fibonacci levels are one type of support and resistance. When a security hits one of the percentage retracement or extension levels, then it is likely to experience a reaction off that price zone.
Keep in mind that when a trader is examining a security for support or resistance, that the first time the support or resistance hits is going to be the strongest, meaning that it will be the most likely to hold. The more a price level is tested, the easier it tends to be to break it. Time does play a roll in here as well, but that is a topic for another day. In addition, the more rapid the momentum of a move is heading into a support or resistance price, the more likely it is to push the limits of that support or resistance zone. If it hits hard enough, it will break.
Once a trader understands the implications of the Fibonacci levels on the market, the next thing is to be able to actually draw, or apply, these levels to a security. If a trader can’t plot them correctly, they are useless. Plotting Fibonacci levels on a chart implies an understanding of trend development. The Fibonacci levels are drawn by first identifying the highs of a downtrend or lows of an uptrend and then projecting them to the lows of the downtrend move or highs of the uptrend move.
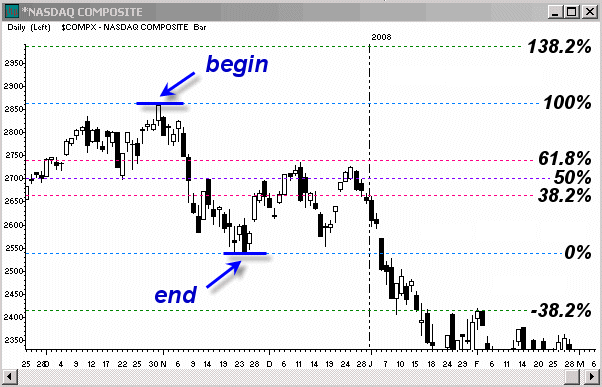
Most of the time, the trend moves which are plotted are actually smaller trends within a larger one. Let’s look at the Nasdaq Composite ($COMPX) as an example of how one can apply Fibonacci to recent trade activity. Heading into November, 2007, the Nasdaq experienced a peak at highs. It broke through a previous low and made a new lower low, establishing a new downtrend. This created the first price level to be used in plotting the Fibonacci levels in the Nasdaq: the October 31st highs. On November 28th, this initial downtrend channel was broken, so this meant that the lows of the November descent could be used to plot the lower end of the trend move and hence the second price level necessary to create a first layer of Fibonacci support and resistance projections.
In many charting platforms, a trader draws these levels by selecting the Fibonacci tool and left-clicking at the highs. They can then hold the button down and drag it to the lower end of the price move before letting go. The result should look similar to what I have shown in Figure 1. I have labeled each Fibonacci level on the right hand side of the chart.
I prefer to use different colors for different percentage levels since as prices development, my initial highs and lows will move off to the left hand side. Using the different colors also let’s me know if the price zones are also previous highs or lows, such as the 100% and 0% retracement levels, or if they are extensions, such as the 138.2% and -38.2%, etc.

Figure 1 – $COMPX Daily
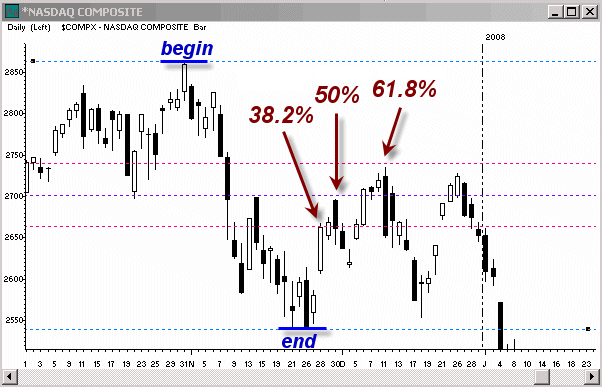
In Figure 2, I have zoomed in a bit on the price action which directly followed the initial swing lower from last year’s highs. The first Fibonacci level to hit was the 38.2% retracement off the lows. This meant that the Nasdaq had retraced 38.2% of the prior descent. Since it hit it with just one day of upside, although it still managed to hold that zone for two days, it was able to break through it for a 50% retracement on November 30th. This greater intraday trend extension helped this level hold somewhat better than the first, leading to a several day correction before moving higher once again into the 61.8% zone.
Notice that in each case the exact price of the Fibonacci level did not hold perfectly, but rather was within a very tight margin of error. Support and resistance levels are zones, after all, and not exact prices. When the 61.8% level hit, however, the momentum had also shifted on the smaller time frames, allowing for a more substantial correction off this resistance zone than compared to the prior ones.

Figure 2 – $COMPX Daily
In addition to retracement levels, Fibonacci levels can be used to identify extension zones, meaning prices which are beyond those traded during the initial price move that was being examined. This can be used to help project prices to new highs and resistance, as well as those on the downside which may also correspond to other forms of price support.
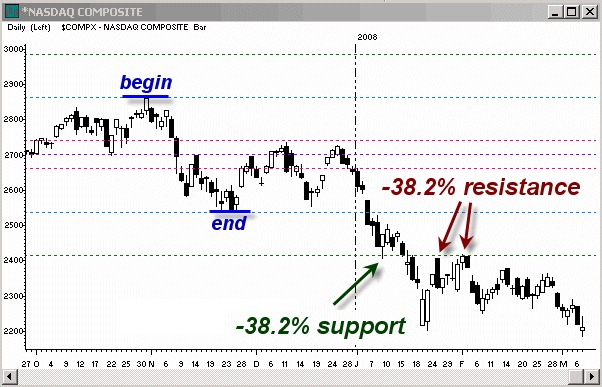
A good example of price extension based upon Fibonacci levels is shown in Figure 3. In this same chart of the daily Nasdaq, I have now highlighted the lower band of the Fibonacci levels: the -38.2% level. This level hit on very strong downside momentum on January 9th, 2008. It pushed the market into a congestion zone for about a week before it was able to break to new lows. When prices rebounded, that same price level served as resistance.

Figure 3 – $COMPX Daily
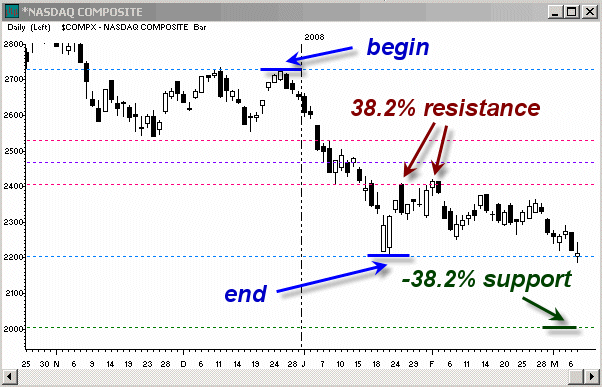
Since the downtrend used in November to project the Fibonacci levels broke in December, the continuation move in late December and into mid-January offered another opportunity to add another set of Fibonacci levels to the index. The downtrend channel from this second large daily drop broke into the 24th and 25th, so the highs of the move on December 26th could be connected to the lows of the move on January 23rd to offer new price projections. These new Fibonacci levels are displayed in Figure 4.
As in the first swing lower in November, the 38.2% retracement level also served as resistance in January. It took several days before it hit, and it did so after a more extreme move lower, so it had an easier time holding that resistance level than it had in December. Currently the prices are testing the 0% retracement level, also known as the previous lows. A break of these lows will place the next Fibonacci support level at about the 2000 price support level in the Nasdaq.

Figure 4 – $COMPX Daily
When I am looking at Fibonacci levels on a chart, there are a few things that I will take into account in order to time a position based upon those levels. I have alluded to them several times already. They include momentum, other forms of support or resistance, as well as the extent of a trend move. Volume can also be a factor.
In terms of momentum, the weaker a move is when a Fibonacci levels hits, the higher the odds are that it will react strongly to that level. For instance, looking back at Figure 2, the move hit the 38.2% Fibonacci level very quickly. The same happened when it tested the 50% level, but by this point the trend was a bit more extended so it held a little better. When it hit the 61.8% retracement level, however, the trend was not only more extended thanks to two waves of upside, but the momentum also shifted with several slower days of upside into the resistance.
Although not shown here, the 61.8% retracement level was also hitting the same price zone as a larger pivot high from in July. Additionally, volume had dropped off significantly, showing a lack of willing buyers going into that resistance. These are all things that I look for to time the highest probability setups. Dropping down to a smaller time frame, such as a 15 or 30 minute chart if the Fibonacci levels are drawn on a daily time frame will also help identify these characteristics more accurately and assist in timing a buy off Fibonacci support or a short off a resistance level, such as the drop from the 61.8% level.
I hope that you have enjoyed this series on Fibonacci trading and now have enough knowledge in your arsenal to begin to apply Fibonacci to your own trading and market analysis. In the next installment, coming out on March 24th, I shall divulge several more advanced applications of the Fibonacci series, taking Fibonacci trading to the next level.
Toni Hansen is one of the most respected technical analysts and traders in the industry with a high reputation for accuracy in both bull and bear markets. Her style of trading and market analysis transcends both time as well as market vehicles, making it attractive to investors and trader of stocks, futures, options, ETFs, and even the FOREX market. Toni is a frequent lecturer at trading clubs and industry expos. She is also a popular market columnist and is a repeat contributor to SFO Magazine. She recently co-authored High Profits in High Heels from Marketplace Books and SFO’s Personal Investor Series book Online Trading. Email Toni.
