The Daytrader’s Ticket to Ride
From 1990 to 1997, Kevin Haggerty served as Senior Vice President for Equity Trading at Fidelity Capital Markets, Boston, a division of Fidelity Investments. He was responsible for all U.S. institutional Listed, OTC and Option trading in addition to all major Exchange Floor Executions. For a free trial to Kevin’s Daily Trading Report, please click here.
The SPX made another new high yesterday at 1074.77, and is +8.3% in 10 days from the 991.97 low (9/2), which was a result of the -4.6% decline from the 1039.47 high, on the 8/28 key time date. This rally has mirrored the decline in the $US Dollar to new lows, as you can see on the USD and SPX daily charts. Just invert the SPX chart and you have the same pattern as the USD, and both each had narrow range Doji bar days yesterday.
Figure 1: SPX Chart
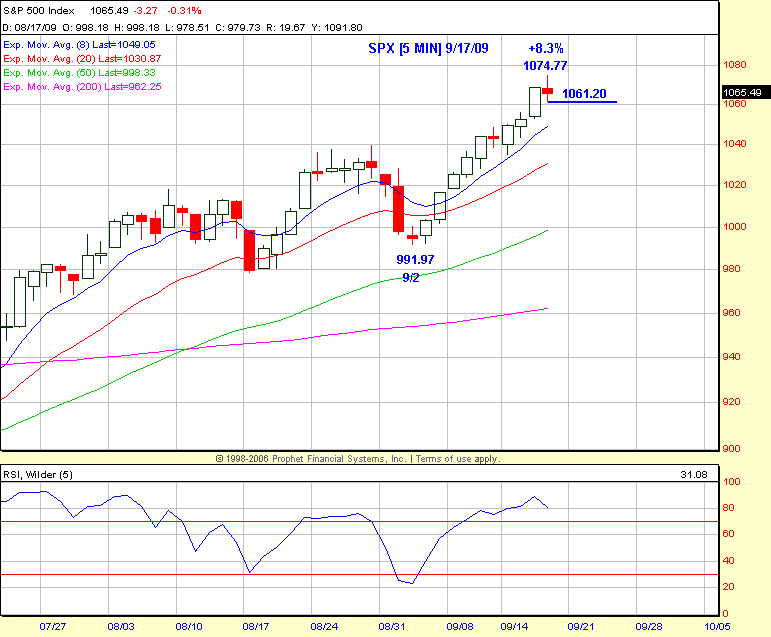
Figure 2: USD Daily Chart
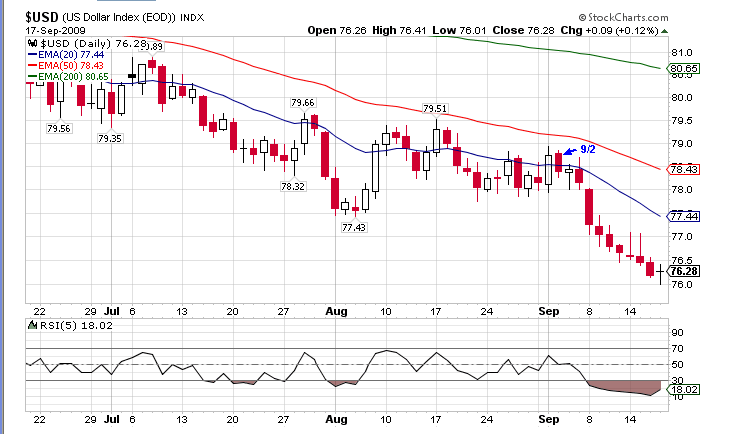
They are both extended in O/S and O/B conditions. However, there can’t be a trading reversal until there is a least a close below the low of the high day, but if you have an existing long trading position, it’s a good time to scale sell into the 1121 .50RT zone, which is only +4.3% from yesterday’s 1075 SPX intraday high. It closed at 1065.49 (-0.3).
I have pointed out in many previous commentaries, that with the SPX and commodity sectors being driven by the $US dollar, it has been, and will continue to be a gold mine for daytraders, because unlike the swing trader, daytraders can play it long or short each day, and sometimes both ways, depending on the fluctuation of the dollar.
I have included the actual 5-minute charts from the Trading Service for Tuesday (9/15), which points out the obvious trading benefits of the correlation. The UDN (dollar down), which is an inverted ETF for the dollar, broke out of a defined triangle pattern above 27.92 on the 11:40 AM bar and went trend up. The B/O was the catalyst to get involved on the long side of the major indexes, and/or the commodity sectors, depending on the best pattern setups.
Figure 3: UDN 5-Minute Chart
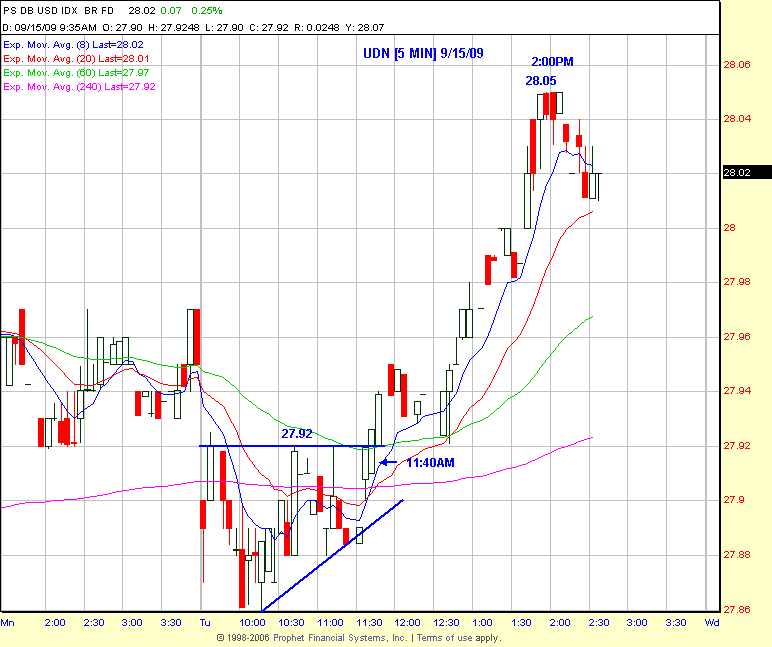
Figure 4: SPX 5-Minute Chart
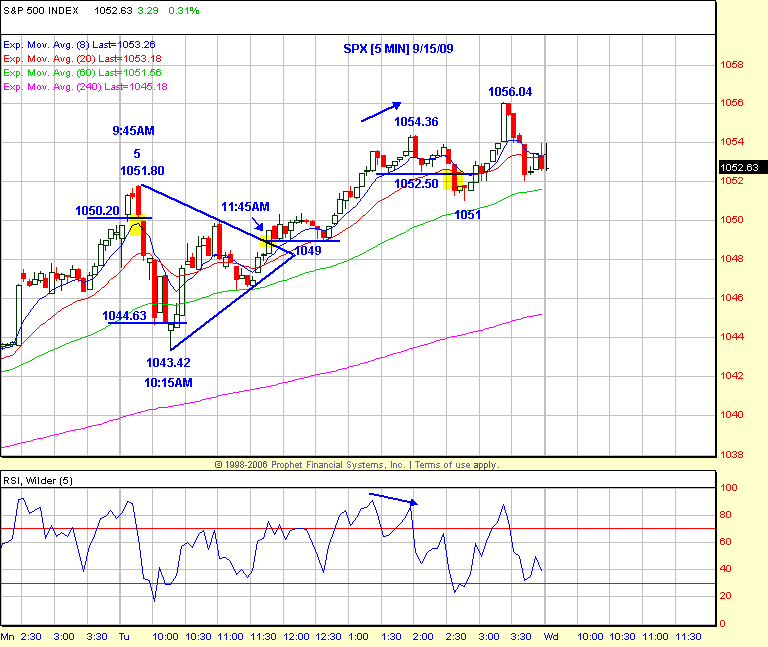
As you can see, the SPX broke out of a contracted volatility triangle on the 11:45 AM bar, as did the XLB from the ascending triangle, and the USO on a 4 bar reversal, so the daytrader was in business on the long side for more Gold, Gold, Gold!
Figure 5: XLB Chart
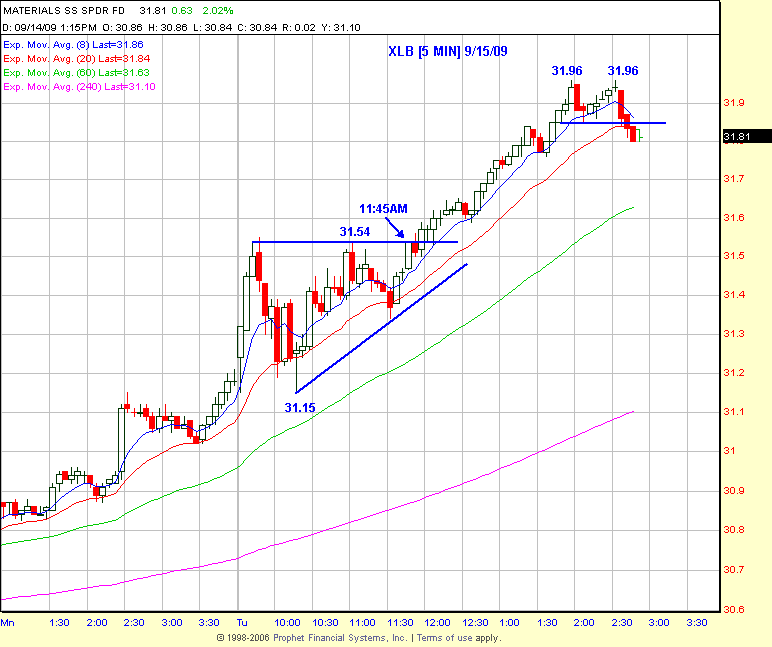
Figure 6: USO Chart
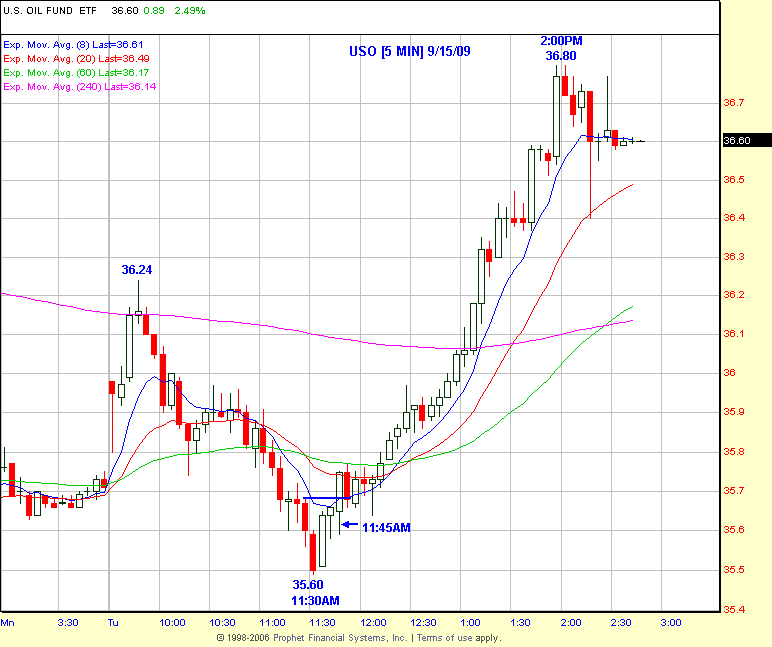
Click here to find full details on Kevin’s courses including Trading with the Generals with over 20 hours of professional market strategies. Plus a free trial to Kevin’s daily trading service.
