Moving Averages and the RSI: Two Exit Strategies for Short Term Traders
Congratulations! You’ve bought an oversold market!
There are many things you’ll notice about your oversold market – whether it is an oversold stock that has closed lower for multiple days in a row, or lost more than 10% in a short period of time, or a high ETF PowerRating exchange-traded fund (ETF).
Click here to learn exactly how you can maximize your returns with our new 2-Period RSI Stock Strategy Guidebook. Included are dozens of high-performing, fully quantified stocks strategy variations based around the 2-period RSI.
The first is that nobody you know will understand why you bought it. The fact of the matter is that most oversold markets don’t look very appealing to the average trader who tends to prefer the “buy high, sell higher” momentum strategy for trading stocks.
The only problem with this approach, as you likely know as a high probability, mean reversion based trader, is there is precious little documented, quantified research to support this approach to short term trading. While many have been successful as momentum-style, breakout traders, many average traders have struggled to replicate that success in their own trading.

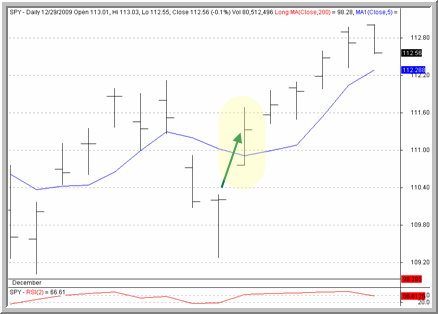
Figure 1. The ^SPY^ shown above in an example of a high probability exit using a close above the 5-day simple moving average.
This is one area where high probability trading in both stocks and ETFs truly shines. Whether it is through tools like the Stock or ETF PowerRatings, short term traders can make high probability, mean reversion based trades (“buying the selling and selling the buying”, as TradingMarkets founder and CEO Larry Connors puts it).
But whether you buy your oversold markets because they have multiple lower closes, big down downs or high Stock or ETF PowerRatings, one question that always stymies new high probability traders: how do I get out?

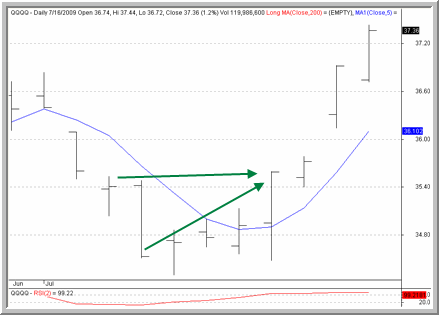
Figure 2. Note here that the ^QQQQ^ closes above its 5-day moving average one day before closing with a 2-period RSI of more than 70 in the wake of this high probability entry from last summer.
I’ve addressed this idea in a number of columns over the years. But with the stock index futures suggesting some strength on Monday, here’s a refresher on the top two exit strategies for high probability traders – including PowerRatings traders.
1. The 5-Day Moving Average: One of the most basic, straight-forward exit strategies that we have tested in both stocks and ETFs is a close above the 5-day moving average. The advantage of the 5-day moving average exit is that it is very easy to track and apply – even for traders not especially comfortable or familiar with technical analysis.
2. The 2-period RSI: Perhaps our favorite exit strategy relies on the 2-period or 2-day Relative Strength Index (RSI). Here, we look for the market to close with an overbought RSI reading, typically more than 70, as our signal to exit stocks or ETFs bought after a pullback.
One of the things that many traders like about the 2-period RSI relative to the 5-day moving average as an exit strategy is that sometimes the RSI exit strategy allows the trader to stay in a trader longer than the moving average exit. This difference is not overwhelming and, again, both exit strategies have tested well.
I will caution traders however to avoid switching exit strategies mid-trade. Decide which exit strategy you will use BEFORE you enter the trade. Consistency in exiting trades is just as important as being consistent about the way you take trades in the first place.
Isn’t it time you gave ETF PowerRatings a try? Our top-rated ETFs have been correct nearly 80% of the time since 2003. Click here to launch your free, 7-day trial to our ETF PowerRatings today!
David Penn is Editor in Chief at TradingMarkets.com.
