Supply & Demand Profits and 3 PowerRatings Stocks
Supply and demand is perhaps one of the most underlying concepts of classical economics. Simply stated, the supply and demand maxim relates to price. If supply increases and demand decreases, the price drops. Conversely, if supply decreases and demand increases, the price climbs. An economic equilibrium of price and quantity results from supply and demand in a competitive marketplace.
This same concept can be applied to stock prices with a twist. When stocks continue to climb, the supply of buyers willing to buy at each upward level becomes less and less. In addition, as more and more buyers of the shares hit their profit targets, they must sell to lock in their gains. This is what is called an overbought stock. Once the buyers have exhausted themselves, price will drop back to the mean or equilibrium in economic terms.
The opposite is also true. After a stock becomes oversold, meaning that the number of sellers at each level becomes less and less. Plus as price drops, it becomes more and more attractive to bargain hunting buyers. Therefore price drops until the supply of sellers is outstripped by the demand of buyers at the reduced price, forcing price back to the mean or equilibrium. This supply and demand type cycle repeats itself again and again. Does it always happen, in all cases ad infinitum? I would say yes, unless the company is delisted, although the time frames of the cycle are not constant.
Our studies have found that after a stock drops for 5 days, the odds of a switch in the supply and demand function increase enough to provide you a significant edge in buying the stock. On the other hand, a stock that has risen for 5 straight days, the supply and demand function switches to provide a significant edge in shorting the stock.
The caveat to our testing is that shares need to be above the 200-day Simple Moving Average for the 5 day drop to provide solidly positive odds of a short term bounce. Of course, shares need to be trading below their 200-day Simple Moving Average for a tradable edge to exist shorting the 5 day increase. Not using the 200-day Simple Moving Average, as a guide, results in the cycle time frame being such that it isn’t quantifiable.
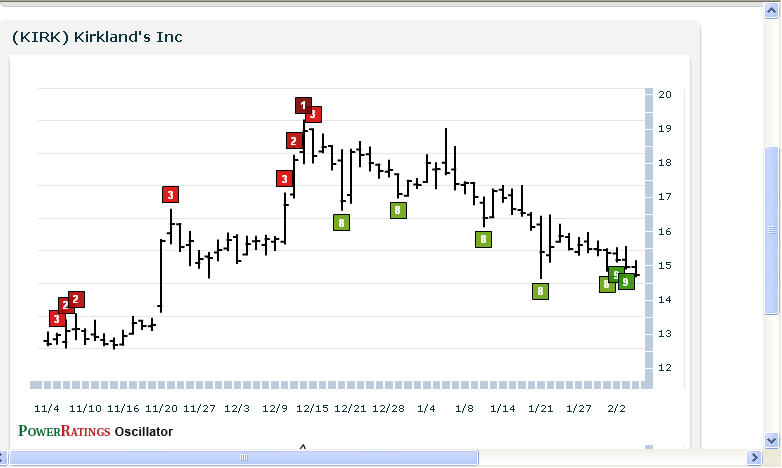
Here are 3 stocks ready for short term gains:
^KIRK^

^CYBX^
^SCL^
Learn more strategies for trading stocks in the short term with a free trial to our PowerRatings! The highest rated stocks have outperformed the average stock by a margin of more than 14.7 to 1 after five days! Click here to launch your free PowerRatings trial today!
David Goodboy is Vice President of Business Development for a New York City based multi-strategy fund.
