High Probability Trading Report: Tips for Trading Below the 200-Day
The fact that so many markets have recently fallen below their 200-day moving averages means that high probability traders need to be mindful of the opportunities and challenges that wait as markets trade around and below the 200-day moving average.
Generally speaking, we like to avoid markets that are trading too close to the 200-day moving average. If we are looking to buy pullbacks above the 200-day moving average, then we would like that market to be at least 1.5% above the 200-day moving average when we begin scaling-in (or if we enter on intraday weakness, in the case of stocks).
Conversely, if we are looking to sell short bounces below the 200-day moving average, then we make sure that any initial position is not taken closer than 1.5% to the 200-day moving average.
This practice simply removes much of the noise that occurs as markets attempt to climb above or slip below the 200-day moving average.

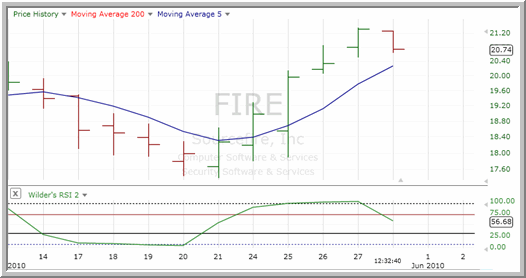
Above: Shares of ^FIRE^ begin to pullback after consecutive days in overbought territory below the 200-day moving average.
When it comes to selling short below the 200-day moving average, high probability traders should look for extremely overbought conditions. In stocks, there are a number of ways to spot extreme overbought conditions, such as high 2-period RSI values above 90 or major gaps up of 10% or more.
With exchange-traded funds, the 2-period RSI is also a valuable tool for spotting overbought markets. Here, a 2-period RSI of more than 70 in an ETF trading below the 200-day should put an exchange-traded fund on your potential short selling watchlist.
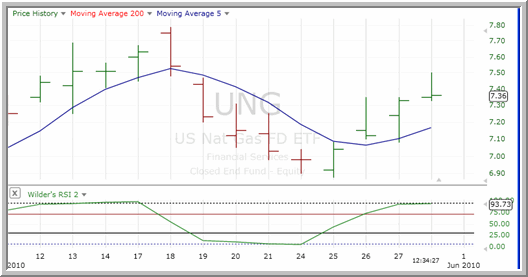
Below: The ^UNG^ has been a consistent source of opportunity for high probability traders looking for ETFs to sell short.

Remember that as volatility increases, it is often a good, conservative strategy to hold out for the more extreme oversold and overbought conditions before taking positions. This is especially true about selling short overbought markets below the 200-day. While it is true that holding out for only the most extreme conditions will result in relatively fewer trades. But our quantitative research into the short term behavior of both stocks and ETFs shows that this kind of patience and discipline historically has been well-rewarded with high win-rates and milder drawdowns.
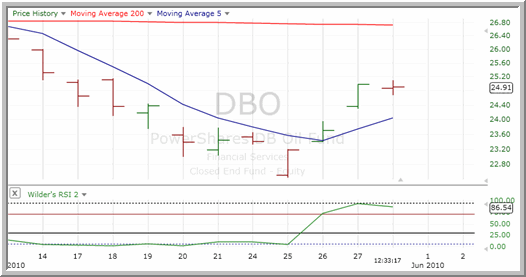
Among those ETFs that are increasingly overbought below the 200-day moving average are a number of energy ETFs such as the ^USO^ and the ^OIL^ and the ^DBO^ (below).

With Larry Connors’ High Probability ETF Trading Software, short term traders have access to the same kind of “buy the selling, sell the buying” trading strategies that professional traders have used successfully for decades.
Click here to start your free trial to Larry Connors’ High Probability ETF Trading Software today!
David Penn is Editor in Chief at TradingMarkets.com.
