Locking in Gains in ETF PowerRatings Trades: Moving Averages and the RSI
With markets rallying from the latest round of oversold extremes, a larger and larger number of ETF PowerRatings traders are sitting on positions in top ETF PowerRatings funds that are moving rapidly toward potential exits.
And while it may take another day of gains for many exchange-traded funds to reach levels where traders can begin taking profits – to say nothing of continued strength on Tuesday – high probability ETF traders would do well to remember which exit strategies have been backtested and quantified for their effectiveness with high probability trading strategies.
Click here to learn exactly how you can maximize your returns with our new 2-Period RSI Stock Strategy Guidebook. Included are dozens of high-performing, fully quantified stocks strategy variations based around the 2-period RSI.
There are two exit strategies that high probability traders should be focused on: the 5-day moving average exit and the 2-period RSI exit. Both exit strategies have proven effective in our simulated trades during backtesting as well as in actual trades taken in Larry Connors Daily Battle Plan (click here to try Larry’s Daily Battle Plan free for a week).
Let’s take a look at both exit strategies in turn – highlighting the advantages of each.
The 5-Day Moving Average Exit
One of our more popular exit strategies is also one of our most straightforward. When buying ETFs after they have pulled back, we look to sell them into strength in the form of a close above the 5-day simple moving average.
We use the simple moving average rather than the other, more exotic versions for two reasons. The first reason is that it works. We have found no significant edge in using exponential, weighted, triangular or other variations compared to the simple moving average.

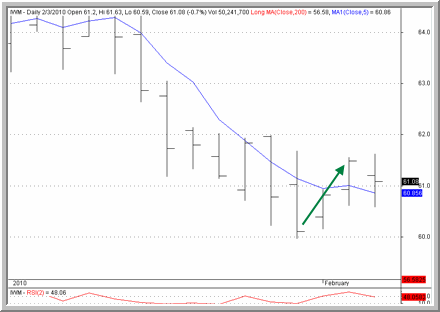
A close above the 5-day simple moving average here in the ^IWM^ signaled the necessary strength for high probability traders to lock in gains after two days.
The second reason is that the 5-day moving average is among the easiest technical indicators to both understand and follow. For many traders who are not familiar with technical analysis, the moving average is both a good first step and, potentially, almost all that a high probability ETF trader needs to know by way of technical analysis in order to successfully make high probability trades.
The 2-Period Relative Strength Index (RSI) Exit
For traders who are more comfortable with technical analysis, the 2-period RSI exit – based on the Relative Strength Index – is an excellent strategy for exiting high probability ETF trades into strength.
The Relative Strength Index (RSI) was devised by J. Welles Wilder Jr. decades ago, and remains among the more popular technical indicators used by traders and market technicians today. A major difference in the way that Larry Connors and Connors Research uses the Relative Strength Index, however, is to change the periodicity (the “look back” period) from 14 periods to 2.

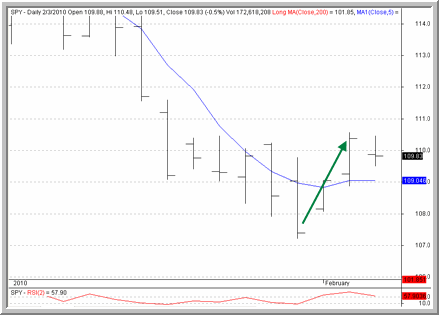
By waiting for the 2-period RSI to close above 70, high probability traders in the ^SPY^ were able to lock in even greater gains from this short term pullback and rally into strength.
Our research has shown that a 2-period RSI does a far better job of indicating short term overbought and oversold conditions (in both stocks and ETFs) compared to the longer, 14-period RSI. This research has been so powerful that we have developed a number of strategies using the 2-period RSI and not just for exits, but for entries, as well.
Typically for trades involving exchange-traded funds bought after pulling back, high probability traders – including ETF PowerRatings traders – should exit when the market closes with a 2-period RSI of more than 70. This is an exit that has been tested both in simulated and live trading.
Isn’t it time you gave ETF PowerRatings a try? Our top-rated ETFs have been correct nearly 80% of the time since 2003. Click here to launch your free, 7-day trial to our ETF PowerRatings today!
David Penn is Editor in Chief at TradingMarkets.com.
