1st Hour Energy Strategy Bonus
Kevin Haggerty is a full-time
professional trader who was head of trading for Fidelity Capital Markets for
seven years. Would you like Kevin to alert you of opportunities in stocks, the
SPYs, QQQQs (and more) for the next day’s trading?
Click here for a free one-week trial to Kevin Haggerty’s Professional
Trading Service or call 888-484-8220 ext. 1.
The SPX finished +1.0% on a sharp reversal of the
-1.4% day on Thursday, on the 2nd lightest NYSE volume of the week, at 1.4
billion shares. The volume ratio was positive at 81, as was breadth +1786. The
last 4 trading days were erratic and news-driven, as the volume ratio was 39,
64, 12, and 81 while the SPX went -0.1%, +0.3%, -1.4% and +1% on Friday. The
"street" continues to spin the mounting negative economic and inflation news,
and even the Fed admitted last week to slowing growth and uncomfortable
inflation levels. However, they continue to inflate the money supply (M3) at
double digit rates (ShadowGovernmentStastics),
and this sea of liquidity has been a major reason this "Teflon" bull cycle has
been extended. The $US dollar has to rally from this 80 zone, or not even the
PPT will be able to manipulate this market higher into the 2008 Presidential
election.
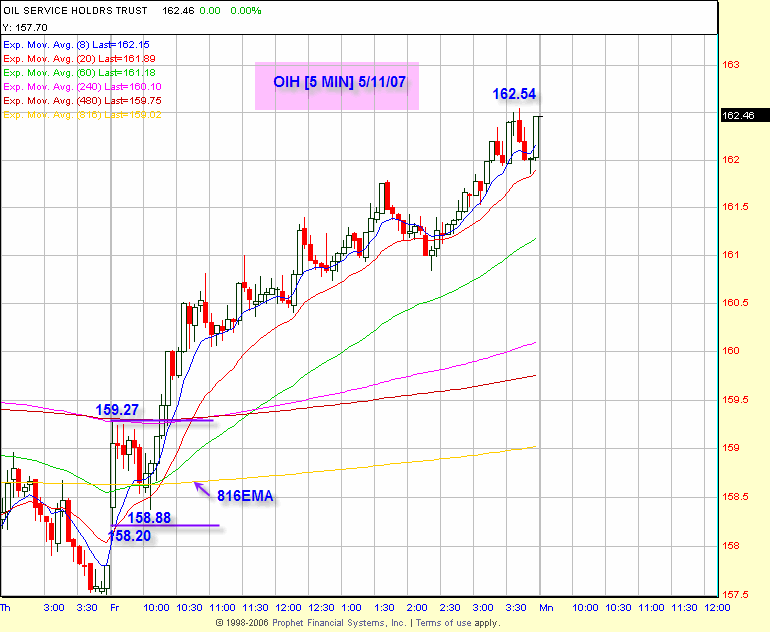
Energy led the rally Friday, with the OIH +3.0%,
and XLE +2.3%, while the $HUI +1.8% and other commodity sector stocks were also
strong. As mentioned in the last commentary (5/9/07), the energy sector has been
the most productive sector for daytraders, and that was the case again on
Friday, with the best opportunities occurring in the first hour, as is usually
the case. The trading service’s primary focus Friday was led by the energy
sector, and I have included several defining strategy setups that members took
advantage of. The OIH had pulled back from the previous 164.08 intraday high
(5/4/07) to the 20-day ema zone of 157.21. This zone has given traders many
opportunities the past 4 days, as the OIH lows were 157.12, 157.66, 157.45 and
158.20 on Friday. After the OIH gapped up on the opening bar, 8 of the following
bar’s ranges were within the opening bar range of 159.27-158.20, and then a
rising 158.88 low, on a pullback from 159.27 to the 816 ema. This is always a
high probability setup. Some traders entered the trade above that bar’s high,
but the strategy entry was above 159.27, and all of the ema’s. This was followed
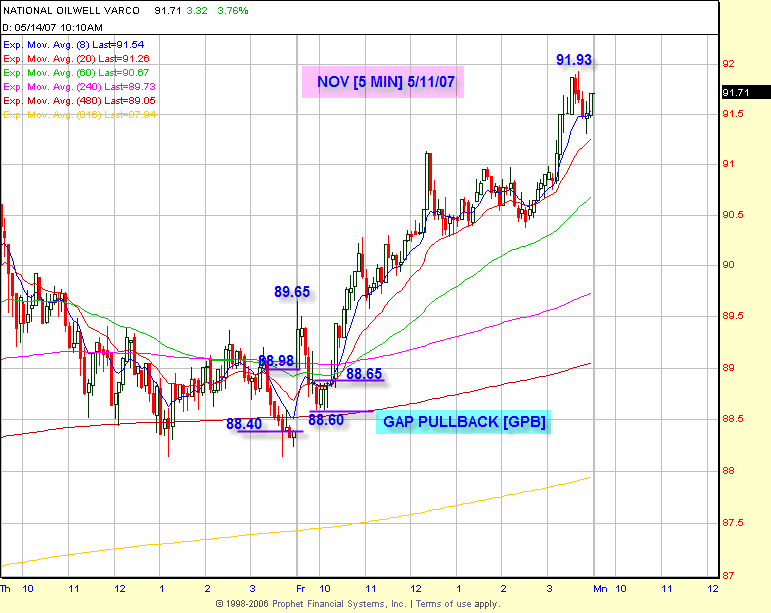
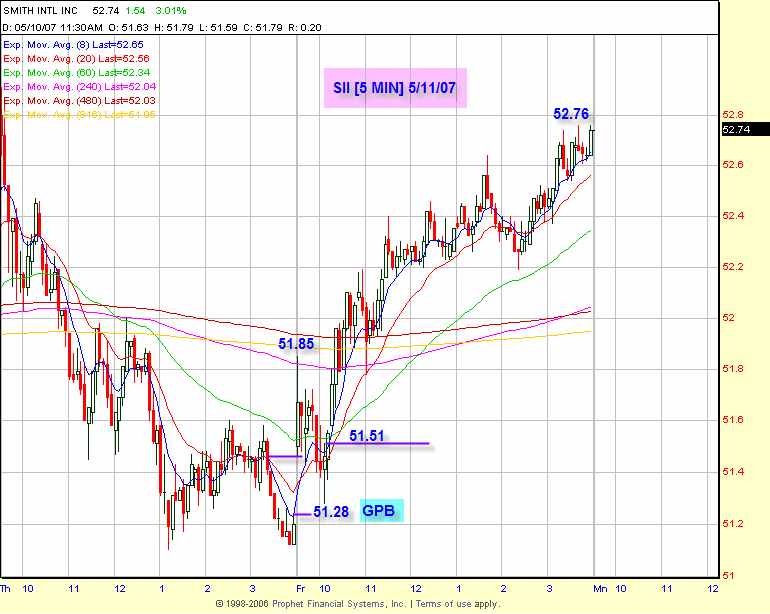
by the move to a 162.54 intraday high, before closing at 162.46. I have also
included the charts for SII and NOV, which are Gap Pullback strategies. There
were many other 1st Hour setups, including an RST in SLB, where the stock ran
from the 72.93 entry level to a 74.57 intraday high, closing at 74.38. The key
is to concentrate in ATL (Above The Line) sectors/groups, and select those
stocks with the daily best chart position each day, and look to enter on any of
the 1st Hour defining strategies. Over the course of the year, the best
daytraders will always have the best daily chart position, which I include in
the trading service on the focus list each day.
There is a cluster of Fibonacci and Gann time
dates this week, in addition to an options expiration, so we will get some more
volatility to play with. Until 1513.80 is taken out, the SPX is in a 1-2-3 lower
top situation, which would be confirmed if the 1491.57 low also gets taken out.
This would put a normal retracement to 1364 in progress, with the Fib levels at
1478.44, 1456.58, 1438.90 and 1421.22. Key Gann angles are 1475.14, 1456 and
1437. Have a good trading day.
Have a good trading day,
Kevin Haggerty
Check out Kevin’s
strategies and more in the
1st Hour Reversals Module,
Sequence Trading Module,
Trading With The Generals 2004 and the
1-2-3 Trading Module.


