2006 first–week focus
Kevin Haggerty is
the former head of trading for Fidelity Capital Markets. His column is
intended for more advanced traders. Kevin has trained thousands of traders
over the past decade. If you would like to be trained by him,
ext. 1.
Year-end 2005 went out with the SPX
-1.7% on the week,
closing at 1248.29, which is a +3% price gain on the year. The Dow finished red
on the year at -0.6% to 10,717, while the QQQQ was +1.2% and Nasdaq +1.4%.
However, the big index gain was the S&P Midcap SPDR
(
MDY |
Quote |
Chart |
News |
PowerRating) at +11.3%, while
the IWM (Russell 2000 Smallcap) was the same as the SPX at +3%. I had said the
SPX would close higher than the 12/20 1259.62 close, and that did not happen.
The SPX did advance to 1271.83 on Tuesday, 12/27, but the sharp reversal on
declining volume sent the SPX 2005 year out at 1248.29. The weak last five days
surprised me that the Generals/hedge funds were not more aggressive marking up
performance because 2006 will most likely will be a down year for them.

There was no question that it was a stock-picker’s year with
no fewer than 25 stock industries showing price gains >=+20%. Energy and
the commodity-related sectors led the way. The mutual funds that have become
quasi-S&P 500 index funds just collected their fees as usual and all they did
was adjust their portfolios with programs to keep in sync with the S&P 500.
That has made it easy to unbundle their research relationships with the “Street”
and just pay for risk capital. They can rely more on their in-house research
staffs to tweak their portfolios so they might be able to outperform the S&P
500, but that still seems to be unattainable for 85% of the pure equity mutual
funds. Go figure…
For 2005, 13 of the top 25 percentage gainers were energy and
related stocks, lead by
(
VLO |
Quote |
Chart |
News |
PowerRating), +127%,
(
EOG |
Quote |
Chart |
News |
PowerRating), +106%,
(
BR |
Quote |
Chart |
News |
PowerRating), +98%,
(
SUN |
Quote |
Chart |
News |
PowerRating),
+92%,
(
RIG |
Quote |
Chart |
News |
PowerRating), +64% and
(
MRO |
Quote |
Chart |
News |
PowerRating), +62%. The OIH HOLDR was +52% and XLE +41%.
It was a total of 125 S&P 500 stocks that had gains of >= +20% for 2005. 236
stocks in the index underperformed the +3% SPX index 2005 price gain with 205 of
these stocks finishing the year on the minus side and 45 stocks that were <= to
-20%. The breakdown is not unlike traders where 80% of the money is made on 20%
of the trades. 2005 ended with the U.S. dollar, long treasury bond, CRB,
industrial metals index, gold and oil all showing a positive price relative
performance to the S&P 500. The U.S. dollar index closed at 91.66 with initial
resistance at 92 and longer-term resistance at 95. I expect dollar
weakness in 2006 led by foreign selling of dollar denominated instruments, with
gold and crude oil being bought strongly on any retracements. The Fed is
changing the money supply reporting requirements significantly in March 2006 and
as I said when they first announced it, the reduced transparency of the Fed is a
significant negative for the equity markets going forward.

I expect to significantly increase the use of long synthetic
straddles in 2006 for the longer-term positions because I would rather bet on
the high probability of surprises and economic disruptions that will mean
profitable volatility, not to mention the most likely bear cycle into at least
the Fall of 2006.
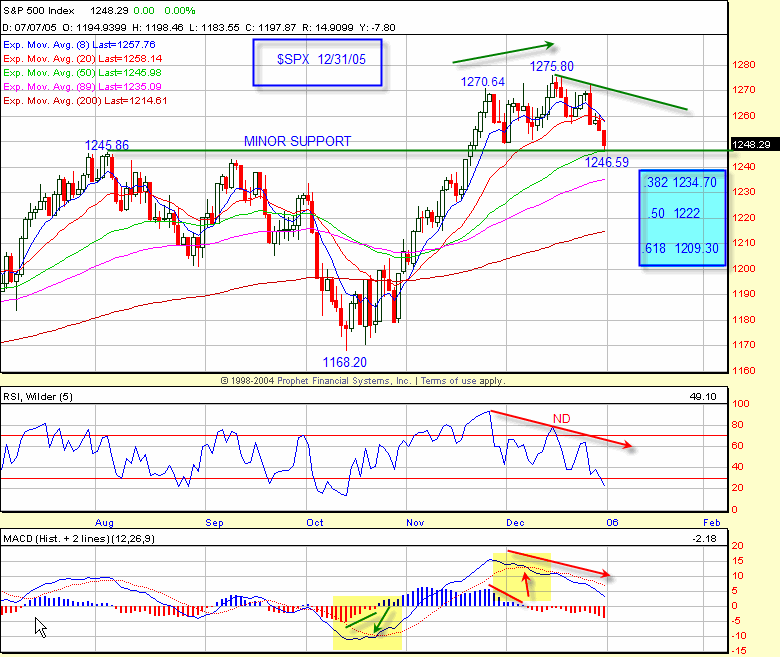
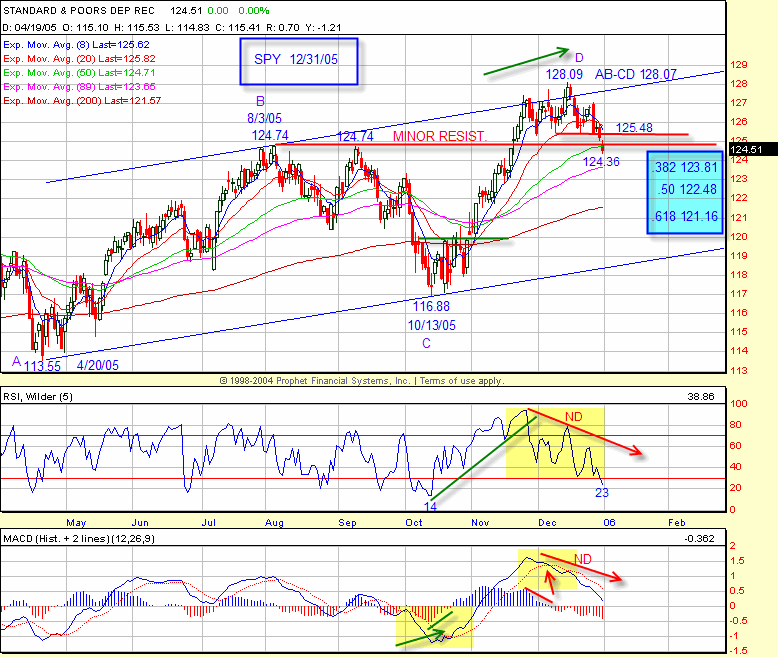
We start the New Year with the SPX (1248.29) right at minor support after last
week’s decline from 1271.64, which was preceded by the obvious momentum and
breadth negative divergences. The retracement levels and moving averages are
outlined on the charts (see SPX and SPY charts). The Dow has some minor love at
10,700, closing Friday at 10,717 and the 50-day EMA at 10,724. A stronger test
would start at 10,400 down through 10,000. For the QQQQ, the initial level is
40.15 and then 37 – 38. Any early 2006 rally extending the SPX Wave 5
above 1275.80 and the Dow above 10,960 will suck the most people into the market
and therefore will be the best opportunity for short-side bear cycle strategies.

I will start the New Year focusing on any activity this week
in certain parts of the energy sector such as the oilfield equipment and service
stocks like
(
BJS |
Quote |
Chart |
News |
PowerRating),
(
CAM |
Quote |
Chart |
News |
PowerRating),
(
NBR |
Quote |
Chart |
News |
PowerRating),
(
RIG |
Quote |
Chart |
News |
PowerRating),
(
SII |
Quote |
Chart |
News |
PowerRating) and
(
WFT |
Quote |
Chart |
News |
PowerRating),
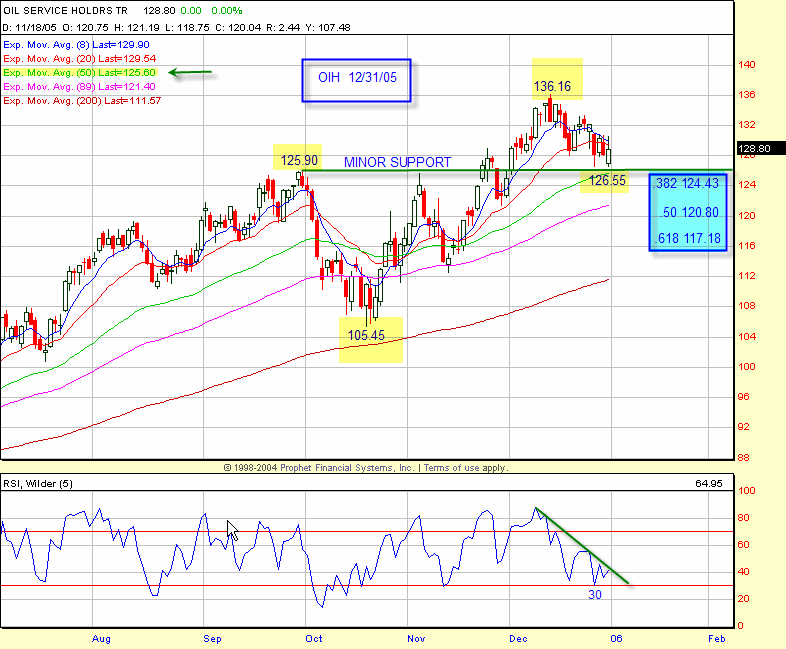
as they are all retracements from new highs to their 20- or 50-day EMAs and they
remain “above the line” stocks. I will also be ready for drillers like
(
DO |
Quote |
Chart |
News |
PowerRating),
(
HP |
Quote |
Chart |
News |
PowerRating) and
(
GRP |
Quote |
Chart |
News |
PowerRating). Technically all these stocks remain very positive and you
can see that from the OIH and OSX daily charts. The energy weakness is in big
integrated oils like
(
XOM |
Quote |
Chart |
News |
PowerRating),
(
COP |
Quote |
Chart |
News |
PowerRating),
(
CVX |
Quote |
Chart |
News |
PowerRating), and
(
BP |
Quote |
Chart |
News |
PowerRating),
all below their 200-day EMAs. Two other energy stocks that have my stock
selection strategy setups are
(
SUN |
Quote |
Chart |
News |
PowerRating) and natural gas stock
(
APC |
Quote |
Chart |
News |
PowerRating). Once
you have anticipated your list of good daily chart setups you are ready to
take intraday entry if the buyers show up and you get good trade-through entry.
Have a good trading day and have a great year in 2006,
Kevin Haggerty
