2 charts that suggest the Dollar selloff is over
Dave Floyd is a professional FX and stock trader based in Bend, OR and the
President of Aspen Trading Group. Dave’s approach to FX combines technical
and fundamental analysis that results in trades that fall into the swing
trading time frame of several hours to several days. For a free trial to
Dave Floyd’s Daily Forex Alerts
or call 888.484.8220 ext. 1.
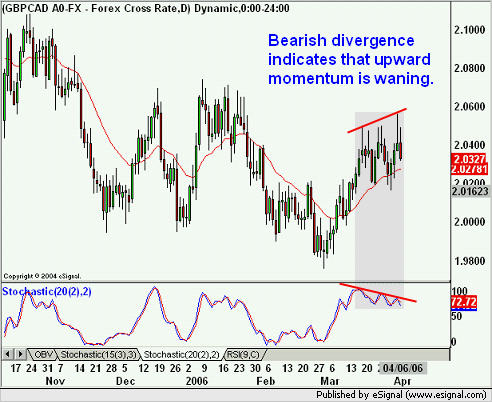
While the dollar’s (DXC) problems may not be completely over,
there does appears to be a brief end to the selling pressure as the charts that
we monitor are all quite oversold and showing bullish divergences as prices hit
new daily lows.
While we would not be looking to go long dollars down here, we would also not be
looking to go short for the time being either. Tomorrow’s ECB meeting regarding
rates, while perhaps prices in based on the move higher in EUR/USD over the last
24-48 hours, will still play a key role for prices. Friday of course brings the
non-farm payroll data (NFP), which will certainly be closely watched. (These
comments were done prior to the ISM release at 10 AM EST).
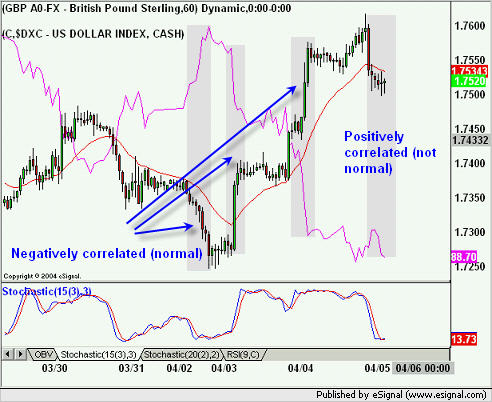
The chart below will highlight a temporary (?) break-down of the dollar index vs
GBP/USD – while this is likely a result of the BoE (Bank of England) comments
earlier today it does force us to avoid the GBP/USD pair for now until this
relationship adjusts back to normal.
It is worth noting that a similar scenario developed a couple of weeks ago with
AUD & NZD – this happened as a result of traders/investors simply selling
deficit currencies as concerns over current account deficits was high. GBP/USD
may fall under the same category, as its current account deficit is rather high
relative to other G10 pairs.
Interesting Chart:
As always, feel free to send me your comments and questions.