2 ETFs poised to move
Both the S&P 500 and Dow Jones
Industrial Average zoomed 0.8% higher yesterday, enabling both
indices to close at fresh five and a half year highs. The Nasdaq Composite
lagged behind with a 0.6% gain, but the index still finished at its highest
level since May of this year. The small-cap Russell 2000 advanced 0.8% and the
S&P Midcap 400 rallied 0.4%. Each of the major indices finished at their
intraday highs, indicating institutional support into the close. The surge to a
new high in the S&P caused its hourly “head and shoulders” chart pattern to fail
and stopped us out of our long position in the UltraShort S&P 500 ProShares
(
SDS |
Quote |
Chart |
News |
PowerRating),
but the broad-based advance also moved our long position in the StreetTRACKS
Homebuilders
(
XHB |
Quote |
Chart |
News |
PowerRating) deeper into the plus column. Continued relative weakness
in the Semiconductor Index ($SOX) limited the advance in the Semiconductor HOLDR
(
SMH |
Quote |
Chart |
News |
PowerRating), which we remain short with an unrealized gain.
Despite the new high in both the S&P and Dow, total volume in
the NYSE declined by 2%. Volume in the Nasdaq, however, was 9% higher than the
previous day’s level. It was the second consecutive “accumulation day” in the
Nasdaq, but it would have been better if higher NYSE volume would have confirmed
the breakout in the S&P. Market internals were positive, but not by a very wide
margin. In the Nasdaq, advancing volume exceeded declining volume by a margin of
less than 3 to 2. The NYSE ratio was positive by 5 to 2.
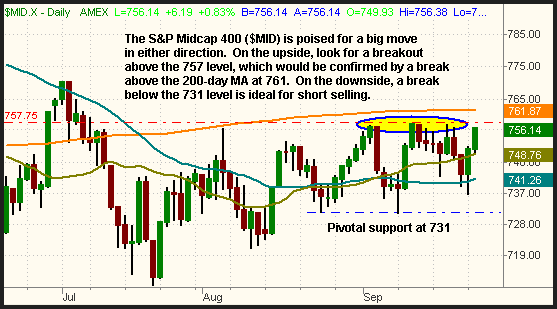
One index that is poised to make a big move in either
direction is the S&P Midcap 400 Index
(
MID |
Quote |
Chart |
News |
PowerRating). While the broad market has been
rallying for the past two months, the $MID index has showed relative weakness by
trading in a narrow, sideways range. Normally, such action would point to the
potential for a selloff on the first broad market correction, but the tight
consolidation could just as easily result in a high momentum snap to the upside.
Looking at the daily chart of $MID below, notice how horizontal price resistance
has clearly formed at the 757 level, but the index has been setting “higher
lows” as well:

As you can see, the 200-day moving average resides at the 761
level, just a few points above the horizontal price resistance. While we would
not buy any of the ETFs that track the S&P Midcap 400 until the index
firmly closes above its 200-day moving average, such price action would
represent a low risk entry on the long side. If the $MID pops to a new
multi-month high above its 200-day MA, the pattern will attract buyers, which in
turn will force the bears to cover any short positions. The end result would
likely be a rapid upward move of at least several days. Conversely, it is just
as much of a “no brainer” to sell short the $MID index if it breaks below the
lower channel support at the 731 level. Obviously, we have no way of knowing for
certain which direction the $MID index will break out, but a move out of its
multi-month range in either direction should be good for a multi-day swing
trade. We recommend setting alerts on your trading software for both a move
above 761 and below 731. Then, rather than anticipating which direction it will
resolve itself, you can simply react to the upside breakdown or downward
breakdown. For now, however, we recommend avoiding the index until it figures
out which direction it wants to go. The S&P Midcap SPDR
(
MDY |
Quote |
Chart |
News |
PowerRating) is the most
popular ETF that mirrors the index, but you get more “bang for your buck” by
trading the new leveraged ProShares ETFs instead. MVV is the ticker symbol for
the ProShares Ultra MidCap 400, while MZZ is the ticker symbol for the
UltraShort MidCap 400 ProShares. If the $MID index resolves itself to the
downside, buying MZZ is much easier and requires less capital than selling short
a comparable position in MDY.
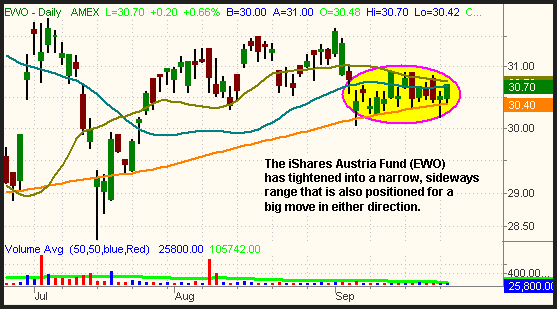
On the international front, the iShares Austria Index (EWO) is
another ETF that is positioned for a big move in either direction. After falling
from its high throughout May and June, EWO began to recover, but was very choppy
and erratic from June through August. It has tightened up into a narrow range
since then, trading in only a 2% range for the past three weeks. This tight
range is circled on the daily chart of EWO below:

As we often see with many stocks and ETFs, the 200-day moving
average of EWO has been acting perfectly as support, pushing it ever so slightly
higher. Both the 20 and 50-day moving averages have also converged in the
vicinity of its current price, both of which will add further momentum to the
eventual move out of the multi-week trading range. The longer it consolidates,
the more dramatic the breakout or breakdown will be, so be prepared for a
substantial move in this ETF. The pivotal resistance level for long entry is
above the September 14 high of 30.90. For short entry, EWO would need to break
below the September 7 low of 30.07. As a reminder, don’t be concerned about the
relatively low average daily volume of EWO. Remember that all ETFs are synthetic
instruments that automatically move in sync with the underlying bid/ask prices
of the stocks that comprise them. Therefore, liquidity is never an issue because
an ETF’s price movement is not based directly on its supply or demand.
Open ETF positions:
Long XHB, short SMH (regular subscribers to
The Wagner Daily
receive detailed stop and target prices on open positions and detailed setup
information on new ETF trade entry prices. Intraday e-mail alerts are also sent
as needed.)
Deron Wagner is the head trader of Morpheus Capital
Hedge Fund and founder of Morpheus Trading Group (morpheustrading.com),
which he launched in 2001. Wagner appears on his best-selling video, Sector
Trading Strategies (Marketplace Books, June 2002), and is co-author of both The
Long-Term Day Trader (Career Press, April 2000) and The After-Hours Trader
(McGraw Hill, August 2000). Past television appearances include CNBC, ABC, and
Yahoo! FinanceVision. He is also a frequent guest speaker at various trading and
financial conferences around the world. For a free trial to the full version of
The Wagner Daily or to learn about Deron’s other services, visit
morpheustrading.com or send an e-mail to
deron@morpheustrading.com .
