2 Indicators to Help You Find Market Bottoms
I have an idea . . . would someone please ring a bell at THE market bottom? That would save all us all a lot of time and trouble!
For sure, roller coaster markets are fun for a while, and I’ve had my share of success in the past two months selling short and jumping in and out of leveraged, inverse, and inverse leveraged exchange traded funds. Still, if your ears are clogged-up like mine are from index cliff falls that reverse into moon shots and vice-versa, maybe you’ll agree with me that a nice, old-fashioned, sustained rally would be a welcome change of venue.
Click here to order your copy of The VXX Trend Following Strategy today and be one of the very first traders to utilize these unique strategies. This guidebook will make you a better, more powerful trader.
That said, since no one has stepped up to volunteer as a bell ringer for THE magic moment when the market’s bottom does settle in, I’ll share with you a combination of two chart indicators that I’ve used successfully over the years. This combination should help you spot bottoming rallies – sustained or tradable – before or just as they begin to turn up.
Predict Bottom Reversal Signals on Weekly Charts
A combination of Slow Stochastics (using the standard defaults of 14, 3, and 3) and the MACD (moving average convergence-divergence oscillator (with standard defaults of 12, 26, 9) nicely predict upcoming bottom trend reversals on hourly, daily and weekly charts.
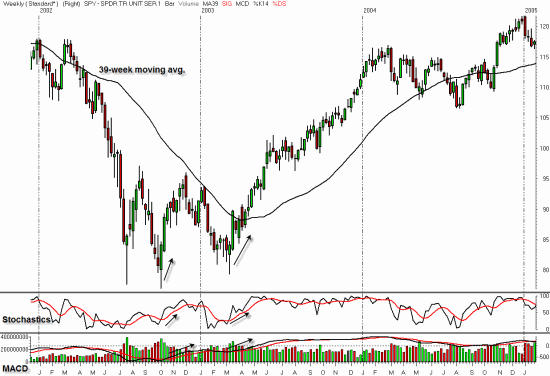
Figure 1 shows a weekly chart of the S&P 500 SPDR (SPY) as the bear market bottom evolved during the latter half of 2002 and first quarter of 2003. As you can see, I’ve plotted Slow Stochastics in the middle scale and the MACD in the lower scale, over the volume spikes.
Figure 1: S&P 500 SPDR (SPY) – Weekly Chart

RealTick ® graphics used with permission of Townsend Analytics, Ltd. © 1986-2008 Townsend Analytics, Ltd
The SPY made its first cliff-fall bottom (look familiar?) on July 21, 2002. Note that Slow Stochastics dipped into oversold territory, and then made a bullish divergence, turning up just before the S&P tracing stock reversed higher. The MACD languished. The indicator was not as impressed with the rally as her “drama queen” colleague. Just so, longer-term traders should take the MACD’s lack of response as a signal that an abrupt sell-off could be lurking – which is exactly what happed in this situation.
The next bottom reversal (arrow) reversal during October 2002 shows the SPY making a slightly lower low, but Stochastics made an early bullish divergence. The MACD confirmed Stochastics buy signal soon after. Although it was a strong multi-week rally, the SPY hit price resistance the week of December 1st, plus a falling 39-week moving average (comparable to the 200-day moving average on a daily chart.) The index subsequently retraced a portion of its prior move down.
In March 2003, the third bottom reversal proved to be the charm, and the SPY moved higher into a sustained uptrend and bull market. Note the early bullish divergence signaled by Stochastics that gave traders plenty of time to catch the bottom. The MACD confirmed the up move soon after.
Forecast Bottom Reversals on Daily Charts
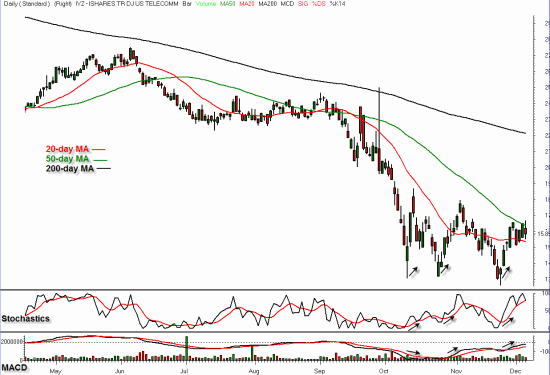
Figure 2 shows a daily chart of the iShares Dow Jones U.S. Telecommunications ETF, symbol IYZ. This example may be a bottom in the making, although upcoming market action will confirm this – or not.
Figure 2: iShares Dow Jones U.S. Telecommunications (IYZ) – Daily Chart

RealTick ® graphics used with permission of Townsend Analytics, Ltd. © 1986-2008 Townsend Analytics, Ltd
Still, traders could have played two, or perhaps three short-term rallies courtesy of Slow Stochastics and its calmer partner, the MACD. (Note the similarities in the price pattern to Figure 1 despite the difference in time frames and trading vehicle components.)
We see the IYZ dipping to a climactic low on October 10th. At this point, our Slow Stochastics was already oversold, and it quickly popped higher in a bullish divergence. But the MACD refused to join the party, a warning to traders that the rally could be (and was!) short-lived.
The IYZ quickly retraced its move up, falling back to retest its prior low. Once again, Stochastics sounded a buy signal, this time from a slightly higher oversold level. The MACD finally agreed to confirm the “drama queen’s” signal and a seven-day rally ensued. Overhead resistance soon took over, however, and Stochastics signaled a quick bearish divergence, warning traders to take profits.
On November 20th, the IYZ fell to its earlier lows, following market action. The next day the telecom ETF turned and reversed, with Stochastics and a more energized MACD leading the way higher.
As you can see, used with common-sense and proper risk management, the combination of Slow Stochastics and MACD can give traders a head’s up and early entry signals to potential bottoming action.
Now – let’s all keep our fingers crossed that we soon hear the ringing of the bottom bell!
Toni Turner is a trader and investor with seventeen years of experience in the financial markets. She is the best-selling author of A Beginner’s Guide to Day Trading Online 2nd Edition, A Beginner’s Guide to Short Term Trading and Short-Term Trading in the New Stock Market. Toni has appeared on NBC, MSNBC, CNN, and CNBC. She has been interviewed on dozens of radio programs and featured in periodicals such as Fortune magazine, Stocks and Commodities, SFO, MarketWatch, Fidelity Active Trader, and Bloomberg Personal Finance.
Toni is the President of TrendStar Group, Inc. For more information about her live and online seminars, as well as additional educational products, please go to
