2 Oversold Stocks and an ETF for Traders
Buying a stock that has been down one day is easy. Buying a stock that has been down three, four or five consecutive days takes nerves of steel. But the more days a stock sells off, the more likely that stock is to outperform relative to the average stock.
This discovery, which was the product of more than a decade of research into short term stock price behavior, has more than a little common sense to it. Particularly when we are talking about strong stocks, stocks in uptrends, stocks that are trading above their 200-day moving averages, the idea of buying during a dip is something that most everyone can understand in short order.
But putting this common sense into practice is often another matter. There is a reason why breakout trading is popular. Few things look more bullish than a stock popping out of a congestion range and notching a new short-term high. While successfully trading breakouts is no easier than any other form of trading, it attracts many traders simply because it “looks” like the best (read: emotionally fulfilling) way to trade.
Our research, which involved examining millions of simulated short term stock trades between 1995 and 2007, indicated that, among other things, those short term highs weren’t such great opportunities after all. In fact, our research showed that traders would have been better off buying short term lows rather than short term highs.
This same research helped uncover the stocks (and one exchange-traded fund) in today’s report. In the same way that we learned that buying short term news lows was more profitable in the short term than buying short term new highs, we also learned that buying stocks that had been down five or more consecutive days provided traders with a better edge than buying stocks that had been up five or more consecutive days.
Again, there is an aspect of common sense. After five days of selling, selling, selling, selling and more selling, who is left to sell? Those who got short in the first few days–for whatever reason–are likely looking to cover. This is especially true if the stocks we are talking about are, as they should be, strong stocks trading above their 200-day moving averages.
In addition to being down five or more consecutive down days, both stocks and the sole exchange-traded fund in today’s report have Short Term PowerRatings of 8. Our research tells us that stocks with Short Term PowerRatings of 8 have outperformed the average stock by a margin of more than 8 to 1. After five consecutive down days, buying high Short Term PowerRatings stocks on intraday weakness is one of many edges we have uncovered that the average trader can incorporate into his or her trading.
To help spot the most oversold situations, I have included the 2-period Relative Strength Index values for all of the below. Anything under 10 is considered significantly oversold, with extreme levels occurring with a 2-period RSI of less than 2.
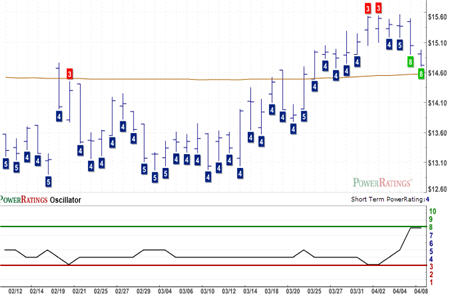
Glafelter
(
GLT |
Quote |
Chart |
News |
PowerRating). RSI(2): 3.25

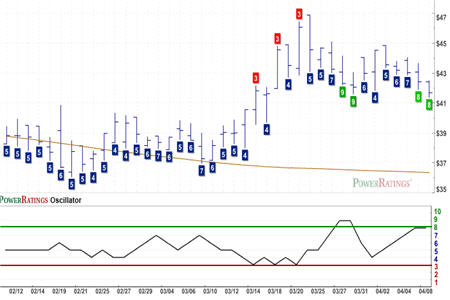
The St. Joe’s Company
(
JOE |
Quote |
Chart |
News |
PowerRating). RSI(2): 5.03

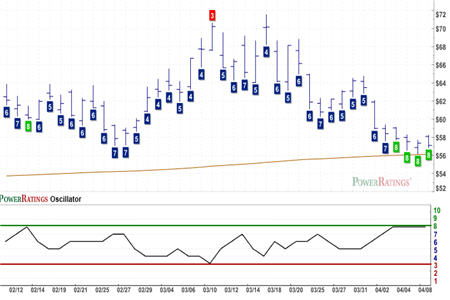
ProShares Ultra Short MidCap 400
(
MZZ |
Quote |
Chart |
News |
PowerRating). RSI(2): 2.35

Join Larry Connors, CEO and founder of TradingMarkets at his weekly Teleconference with TradingMarkets Senior Editor David Penn Thursday, April 10th at noon as they discuss the new opportunities for stock traders in the current market.
Click here to reserve your spot today and come see stocks the way a pro sees stocks. You’ll be glad you did.
David Penn is Senior Editor at TradingMarkets.com.
