2 Rules to Help Find the Best ETFs to Trade: IWM, EWT, ILF
As Larry Connors noted in this morning’s Daily Battle Plan, we have more oversold ETFs in our database as of Tuesday morning that we have seen in years.
This is a combination of a few factors. The sideways consolidation over the past several days helped reduce both the short-term historical volatility of the market as well as overbought conditions that had lingered after the market’s run-up. And by “run-up” I am referring both to the larger move off the March lows as well as the most recent push higher from the past few days of May.
iShares Russell 2000 Index ETF –
(
IWM |
Quote |
Chart |
News |
PowerRating)
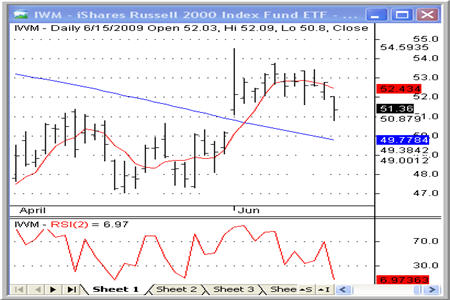
But the other major aspect of the unbelievable large number of oversold ETFs we are seeing today has to do with the fact that so many ETFs have crossed above their 200-day moving averages. There have been large numbers of oversold ETFs in the past, but insofar as these ETFs were trading below their 200-day moving averages, we were not interested in them as potential trades. But with so many ETFs – from equity index funds to country funds to sector ETFs – having climbed above their 200-day moving average here in mid-2009, it was no surprise that a sell-off such as the one we saw on Monday was able to create so many oversold ETFs.
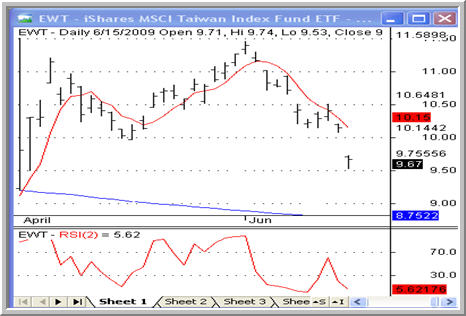
iShares MSCI Taiwan Index ETF –
(
EWT |
Quote |
Chart |
News |
PowerRating)
How do traders wade through this almost-intimidating number of funds to find those that might make for the best high probability trading candidates?
Two strategies can help here. The first, as we noted as part of our educational series on ETFs, is to stick with ETFs that represent either equity indexes or the stock markets of other countries such as China, Brazil or Germany. We found in our research that these ETFs tend to move back and forth between oversold and overbought conditions more consistently than other ETFs. These types of ETFs should always be at the top of your list when it comes to time look for trading opportunities in oversold and overbought funds.
iShares S&P Latin America 40 ETF –
(
ILF |
Quote |
Chart |
News |
PowerRating)
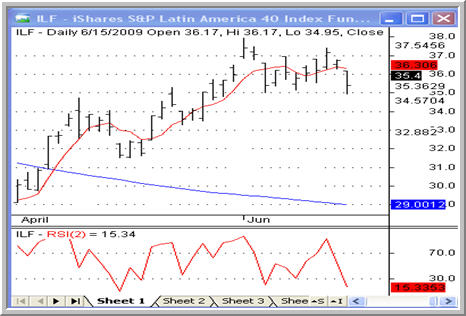
The second tip is to use the 2-period RSI to find the most oversold ETFs within your narrowed down list of equity index and country ETFs. The 2-period RSI is one of the best indicators for short term high probability ETF traders and buying using the RSI traders can not only spot which markets are oversold and which are overbought. Traders can also distinguish between those ETFs that are only mildly oversold (and may have further to fall) and those ETFs that are already in extremely oversold territory and more likely to attract buyers in the short term.
When looking to trade ETFs using high probability strategies, keep these two tips in mind. They will be especially helpful in sorting through a variety of potential trading opportunities to find the ones that have the best edges in your favor. For more tips on how to find and trade the right ETFs every day, click here.
According to a recent report, eight out of ten securities traded are exchange-traded funds. Want to learn how to trade them? Click here to pre-order High Probability ETF Trading, the first quantified book of trading strategies to improve your ETF trading.
David Penn is Editor in Chief at TradingMarkets.com.