2 Ways to Find Reversals Off Support and Resistance
Utilizing Fibonacci Retracements with Gann Fans
A common question traders have is, what are some good tools for finding support and resistance levels? Nowadays, even the most basic retail charting platforms come loaded with tools used to find these key areas. Unfortunately, many traders are not sure how to use these tools correctly and more importantly; how to implement and combine these powerful tools. Using these tools on your own will help you identify areas of support and resistance. Using these tools together drastically increases the probability of a confirmed breakout and a big move. We will look at 2 of these tools in this article, Gann Fans and Fibonacci retracements. We will also look at volume as a confirming factor.
Click here to order your copy of The VXX Trend Following Strategy today and be one of the very first traders to utilize these unique strategies. This guidebook will make you a better, more powerful trader.
1. Gann Fans
William Delbert Gann was born outside of Lufkin, Texas in 1878. Gann was a financial genius, he started trading at the age of 24 and accumulated a fortune worth over $50 million. Gann developed many trading philosophies using a variety of methodologies. His works have been published for nearly 100 years and are still very much relevant. Gann’s most well known contribution to the trading world is the Gann Fan. The Gann fan is made of a series of angles drawn from a pivot high or a pivot low. The most important of these angles is the 1×1 angle. The 1×1 angle is a 45 degree angle in an uptrend and 315 degrees in a down trend. Below is an example of a Gann Fans.
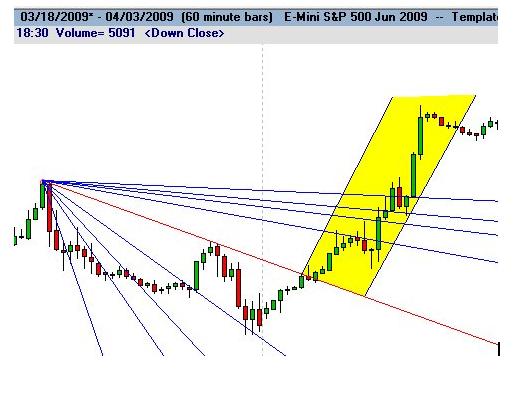
As you can see, the price trends up to the 1×1 angle very closely and when it breaks the trend line we have a nice move. The other angles of the fan are important however the key angle is the 45 degree 1×1 angle. Using a Gann fan is a good way to find support, however using only a Gann fan can lead to false breakouts and head fakes. Gann fans should be used in conjunction with other drawing tools to find the areas with the highest probability of predictable price movement.
2. Fibonacci Retracements
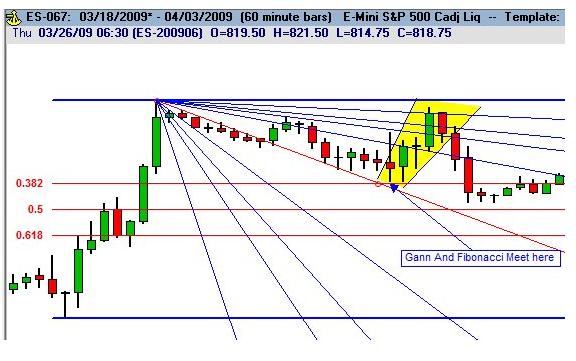
Leonardo Fibonacci was an Italian mathematician who is most famous for his work with number sequences. The Fibonacci sequence is 0, 1, 1, 2, 3, 5, 8, 13, 21, 34, 55… The sequence adds the two previous numbers together to get the next number and so on and so on. By dividing the last two numbers of the sequence, i.e. 34/55=61.8 we get the 61.8% ratio. Often referred to as the “golden” ratio, many prominent scientists and mathematicians have spent decades examining the ratio and how it applies to nearly everything from the swirls on a Conch shell to the distance between stars. As the numbers in the Fibonacci sequence increase, dividing the last two numbers in the sequence gets closer and closer to 61.8%. The other ratios are found by dividing alternative numbers of the ratio, i.e. 21/55=38.2. This is a very popular tool for finding key support and resistance. Drawn from a swing high to a swing low, the Fibonacci ratios give 2 key areas of support and resistance; the 61.8% retracement and the 32.8% however most Fibonacci tools will have the 50% ratio as well even though it is not derived from the Fibonacci sequence. Below is an example of Fibonacci and Gann used together to spot key areas of support and resistance. These areas are used to confirm breakouts and also should be used to place stop loss and take profit levels.
Volume
Another important tool for identifying meaningful breakouts is volume. Volume is important because many times a move on weak volume will appear to be a breakout, and not follow through. Using any of these tools alone will give you some idea of where moves will happen. Using these tools together will give a much higher probability of confirmed breakouts and meaningful gains. On this chart there is a head fake move up on light volume, followed by the breakout down on rising volume. As you can see, using any one tool on its own may have lead to taking the trade too early and getting stopped out. But when we put all three of these tools together we have a much higher probability of finding good breakouts and more importantly avoiding head fakes.

In the above example, there are many things going on. The first move is the 50% retracement that also coincides with the 1×1 Gann line for an area of strong resistance. As the price begins to retest the first retracement it breaks the 1×1 Gann line on declining volume. The result is a failure to break through the 38.2% retracement. As the price falls on rising volume it breaks through the original support but the 1×1 Gann line serves as new support and the price does not break it.
Summary
Traders should be aware of these key levels for several reasons. The theory of technical analysis is based on the idea that many people looking at the same information will come to similar conclusions, basically the only reason it works is because enough people believe it does. Using these technical levels can give you a better chance of spotting the meaningful breakouts that lead to nice gains. These tools are not limited to any one financial market and can be applied to futures, forex, equities etc… There are many more tools for finding support and resistance however these are two of the more popular ones and therefore should be understood and considered. Volume is also very important to confirm the Gann and Fibonacci levels because light volume moves tend to reverse quickly stopping traders out before the big move. Using these tools together will help you identify the areas for big moves and help to set yourself up for success.
Disclaimer: FastBrokers’ market commentary is provided for information purposes only and under no circumstances should be regarded neither as an investment advice nor as a solicitation or an offer to sell/buy any financial product. FastBrokers assumes no responsibility or liability from gains or losses incurred by the information herein contained.
Risk Disclosure: There is a substantial risk of loss in trading futures and foreign exchange. Please carefully review all risk disclosure documents before opening an account as these financial instruments are not appropriate for all investors.
Jesse Richards is a Series 3 registered Commodities Futures Broker. Before getting his license, Jesse was a full time e-mini and stock options trader. He has spent time with a major U.K hedge fund and currently works for FastBrokers, a California based online Futures and Forex brokerage. For more information about FastBrokers please visit www.fastbrokers.com/index.php?JR750.