3 Price Patterns That Every Trader Should Be Aware Of
Every trader should know the basics of simple price patterns on their charts. These repeated arrangements of price bars are nothing more than the human emotions of fear & greed measured with real money at work in the markets. The best part is, basic chart patterns have existed since charts were invented, probably drawn on pressed paper with quill pens. Price patterns repeat themselves in all markets with no exceptions. They are visible in all timeframe periods on charts, and they function exactly the same regardless of all else.
My first exposure to chart patterns rolls back the calendar about twenty years to a bulk mailing booklet that found its way into my mailbox from some guy wearing a cowboy hat. The premise promoted in there was to simply watch charts and wait for basic price pattern consolidations to break, trade in the direction of those breakouts and manage trades accordingly from there. That overall concept worked then, works now and will always work forever … with far more specifics than were explained in the booklet.
Click here to learn how to utilize Bollinger Bands with a quantified, structured approach to increase your trading edges and secure greater gains with Trading with Bollinger Bands® – A Quantified Guide.
Pause In Price That Refreshes
Flags, pennants and wedges come in different shapes and configurations. Sometimes the patterns are rectangular or square, other times flags are shaped in triangle or wedge form. It really doesn’t matter though, the general gist of things remain the same. Price action has made a directional move and is now consolidating energy for the next push to come. As always, that push could be up, down or sideways from there. However, there is a bias for price patterns = consolidations to break out in continuation of the direction they were entered. In other words, price action moving higher that pauses into a flag is more likely to keep moving upward when it breaks. Same is true for flag patterns breaking downward within a price move lower.
Flag patterns help to show there orderliness and predictability exist within seeming random chaos. They often form after price action has chopped or rolled sideways through indecision, and then staged its first directional push outside of the neutral sideways range. Fundamentally, flag patterns can be thought of as a tipping point in the losing battle between buyers and sellers. For awhile, each side pushed equally hard and could not move price action in either direction. Eventually, one side or the other prevails. Whether it is the buyers or sellers, that first directional break from a consolidated range catches the other side by surprise. Buyers are not convinced a market is going lower, sellers aren’t convinced it is going higher when the first real push begins. Flags are the result of the losing side pressing their case in a futile effort, one more time.
You can think of price action in financial markets as a continual tug-of-war game. Buyers and sellers pull the tape both directions in attempt to enforce their desire or will. Much if not most of the time, each side is pretty well matched. At certain points of time, one side or the other will clearly overwhelm the other. Price action breaking out of flag patterns is one of those times where the tipping point is visible, and one side or the other tugging on that proverbial rope is about to be dragged through the mud pit.
ES 1-Minute Chart
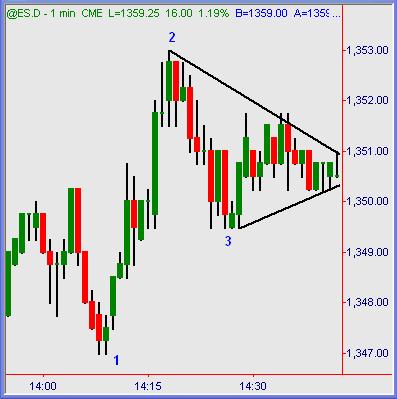
In this example of the E-mini S&P futures, price action staged a bullish 1,2,3 ascent of higher highs and higher lows. It then consolidated inside a wedged flag pattern for about fifteen bars (minutes) of directional indecision. While watching this tape live, you could literally see the tension mounting before the next inevitable push. Because price action entered this flag in upward fashion, upwards continuation has the odds of probability in favor.
ES 1-Minute Chart
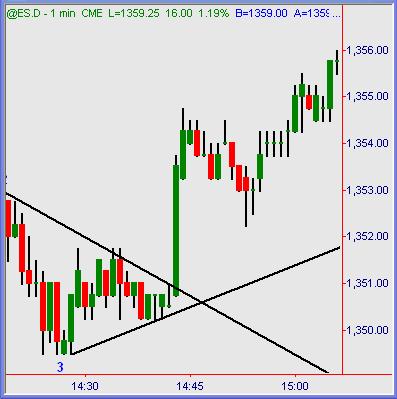
One the buyers gather their composure inside that period of rest, the upside breakout was (relatively) dramatic. A long bar on obviously accelerated volume overwhelmed sellers trying to halt the ascent. From there price action continued to flag and rise upward into the afternoon.
NQ 1-Minute Chart
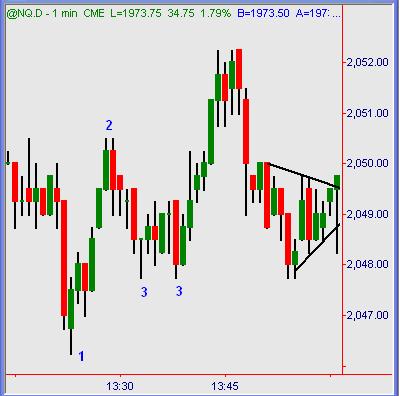
Another day, another time shows the same sequence of events in Nasdaq 100 E-mini futures. Price action makes a swing high from 1,2,3 patterned ascent. It goes on to post a higher high, then pulls back into the most recent range. Lower highs and higher lows press the the bars into a narrowed compression that cannot last.
Trendlines connecting lows and highs clearly show where the zones of breakout confirmation exist. A slight close in price action outside the upper trendline of resistance appears to confirm upward continuation from there.
NQ 1-Minute Chart
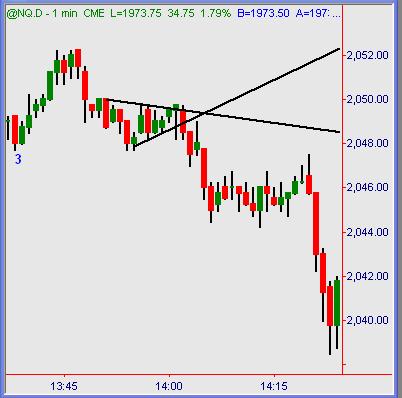
But that didn’t happen. Following one brief close above that flag, price action immediately broke lower and failed through the bottom support of this pattern example. An initial break lower settled into another sideways coil, which then broke lower with gusto as it continued the directional push.
The move lower following the failed breakout was especially powerful. Buyers who were eager to chase the upside breakout got trapped long and had to bail at their protective stops and/or flip positions to net bearish. Sellers who waited for a downside breakout were selling. Net result in this case, everyone was doing the same thing for different reasons: selling. This tug of war match here saw the bulls dragged through that mud pit by the bears. A failed flag pattern showed the tipping point.
Summation
Simple price patterns have always worked in the past, they still work today and my guess is that they will always behave the same way in the future. It is the pure measurement of market behavior going through its endless cycle of range expansion and contraction in visible form. That does not mean that patterns and/or pattern breakouts can be worked as pure trade signals or entry point on their own. Sometimes, but not always or even a majority of times. However, knowing how to spot, read and measure price flags on a chart will give you a clear picture of what is probable to happen next… an edge to position yourself long or short as consolidation leads to expansion ahead.
Austin Passamonte is a full-time professional trader who specializes in E-mini stock index futures and commodity markets. Austin trades privately in the Finger Lakes region of New York. Click here to visit CoiledMarkets