3 Reasons Why the EUR/GBP Rally is Not Convincing
Although I am on vacation here in Buenos Aires for a month and told myself I would only trade during this time, I thought I should at least write an article or two while I am down here. In case you have not been to Buenos Aires or Argentina for that matter, I highly recommend it especially during winter in the U.S. as its the peak of summer here in the Southern Hemisphere.
The weather is beautiful, the portenos (local Argentinians in BA) are warm, friendly, charming, social and among many other things, BA is a city that never sleeps with endless things to do while only being a few hours flight from Rio, Santiago and Montevideo – three other amazing South American cities.
However this post is not designed to be about my quite relaxing and well needed trip to South America, but about trading and a particular chart I am finding to be interesting.
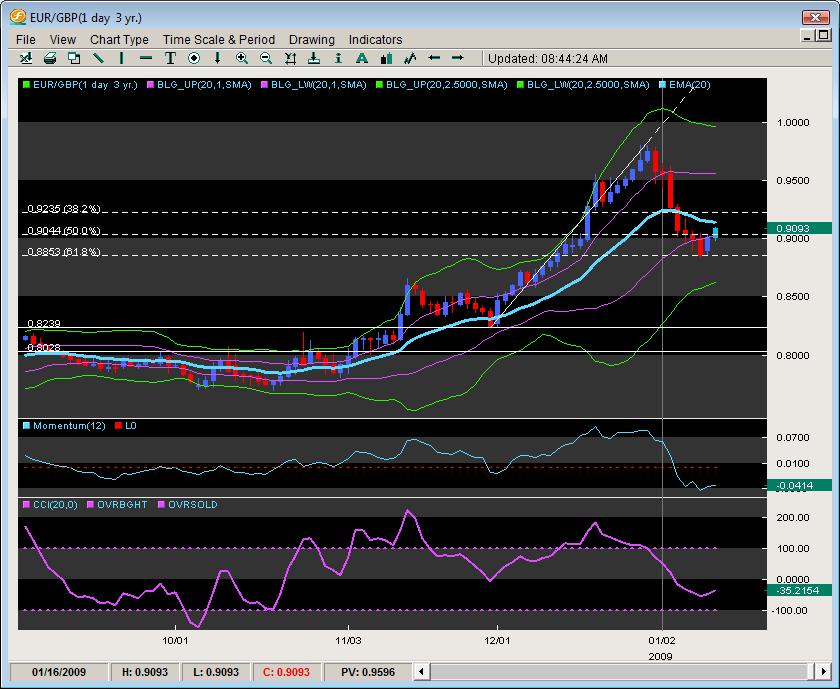
Taking a look below at the daily chart of the EUR/GBP, we are seeing how the pair started a major reversal of the 1 year relentless attack on the 100 pence mark with the first legitimate reversal taking place just before we entered 2009. The pair did not create a technical bearish engulfing pattern but it did follow through in the exact same manner as the pair sold off a total of 8 consecutive days closing below the 20EMA on Jan. 6th and never resurfacing since then. This is the longest stay below the 20EMA on the daily charts since early/mid October and the market was quite flat at that time so this seems to be acting as quite a different animal.

The pair has since bounced from its yearly lows from .8836 to .9072 at the time of inking this post but we feel the rally is not convincing for several reasons:
1) The Momentum reading is quite dreadful and would not inspire me as a Momentum model trader to buy this pair. Remember according to the Momentum indicator, there are three general models of analyzing it in relationship to current price action. The Healthy model is when the momentum reading is ahead of price action. Thus if the price has retraced 38.2% of its most recent down move, then momentum should have retraced more than 38.2%. This is not the case here and the momentum cannot even pick itself off the bottom of the charts which suggests the internal momentum or energy behind this bounce is really unconvincing.
2) The 20EMA is relatively flat and getting more flat as price approaches it. Normally, when you have a healthy bounce, the 20EMA would manage some sort of continual curvature or arc to the indicator in relationship to price and start to curve upward suggesting the acceleration of price is not only upward, but is also negating the previous sell-off which turned the 20EMA downward to begin with. A smooth curve would suggest a healthy rally and a building up of positions while a sharp turn would suggest a strong or violent reversal. Neither of these are coming about here so we are less impressed with this reversal.
3) 61.8% fib + the CCI reading suggest also the bounce will not be followed through with a strong upward push. Normally, when a pair bounces off a 61.8% fib level and the bounce is going to be strong, the CCI has not only reached some sort of -100 reading but has significantly diverged before the bounce and resurfaced above the -100 line and likely started to attack the 0.0 figure before pulling the pair upward. This too has not happened and it looks like the CCI cannot even pull up its bootstraps to manage a positive reading even though the pair has bounced 250 of the 1000 pip fall (25%).
With all that being said, we expect the reversal or current rally to be rejected and the pair to resume its descent making a new low for the year within the next week or so, and the timing could not be right with the ECB set to meet this week with a more probably rate cut on the cards. In terms of what levels we expect to reject this pair, we are listing a few below:
1) Daily 20EMA currently clocking in at 0.9140ish (aggressive but a level definitely watched by chart technicians)
2) the 38.2 or 61.8% of the current 1000 pip down move (either .9222 or .9448)
3) .9235 which is the 38.2% fib retracement of the last 1600 pip upleg starting at .8239 managing a high in 2008 around .9817
4) .9500 being the big figure and next round number to contend with
We expect the pair to the resume the downtrend and head towards the following levels:
1) .9045
2) .8851
3) .8672
4) .8500
Ciao from Buenos Aires
Chris Capre is the Founder of Second Skies LLC which specializes in Trading Systems, Private Mentoring and Advisory services. He has worked for one of the largest retail brokers in the FX market (FXCM) and is now the Fund Manager for White Knight Investments (www.whiteknightfxi.com/index.html). For more information about his services or his company, visit www.2ndskies.com.
