3 Tips to Profitably Day Trading E-minis
Today we’re going to talk about 3 things you can implement in your trading to help you define your edge in the market.
Like most traders, I had a very humble beginning in my day trading career. I opened my first trading account back in 2002 and promptly took it from $5,000 to zero in about 2 weeks. I spent the next 4 years buying every system, indicator, and course I could find to try and make a living day trading.
Click here to learn how to utilize Bollinger Bands with a quantified, structured approach to increase your trading edges and secure greater gains with Trading with Bollinger Bands® – A Quantified Guide.
Now, I’m surrounded by a team of extremely knowledgeable, professional traders. In this article I’m going to talk about a few things we discovered throughout the years and now implement in our trading business.
In any trading strategy or system I evaluate, I look for a few key components. The main purpose of these components is to give us an identifiable “edge” over the market. As short term traders, we need to be confident that every trade we take has a statistical probability of working out in our favor. The following is a list of 3 things we look for when day trading e-mini futures.
1. Don’t pick tops or bottoms
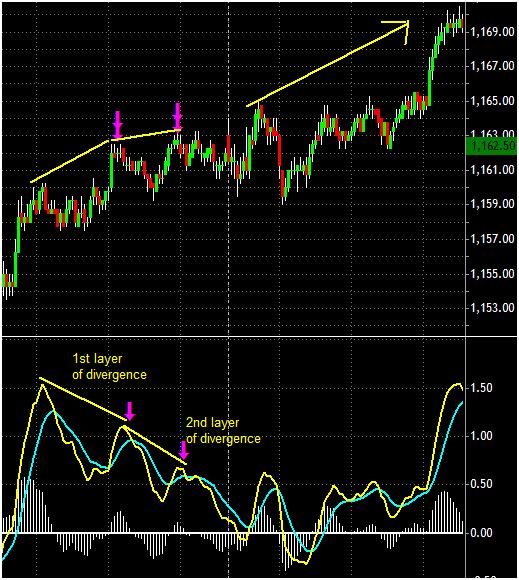
If you want a sure-fire way to stack the odds against you, then try and pick when a trend is going to end. There are many indicators that give hints to when a trend may be coming to an end, but statistically they are wrong more than they are right. For example, the MACD indicator shows us weakness in a trend by showing us “divergence”. While divergence can be a pattern to keep a close eye on, it does not confirm that a trend has ended.
In the chart below we are in an uptrend followed by two times of MACD bearish divergence. Keep in mind, divergence is only the “potential” for a down move. It does not mean that any selling pressure has come into the market. Until there is a clear indication that the trend has broken to the downside, the probabilities say that the uptrend is likely to continue. Notice that the divergence pushes price back to the support level at 1159.00, but does not change the overall market direction.
Chart 1
2. Enter trades at low-risk, high-probability areas
The best way I’ve found to minimize risk and maximize reward is to enter into trades when I have a low risk, high probability area. A good example of this is to get in on a pull back to an area in anticipation that the trend will continue in the original direction. Some traders refer to this as “trend trading”.
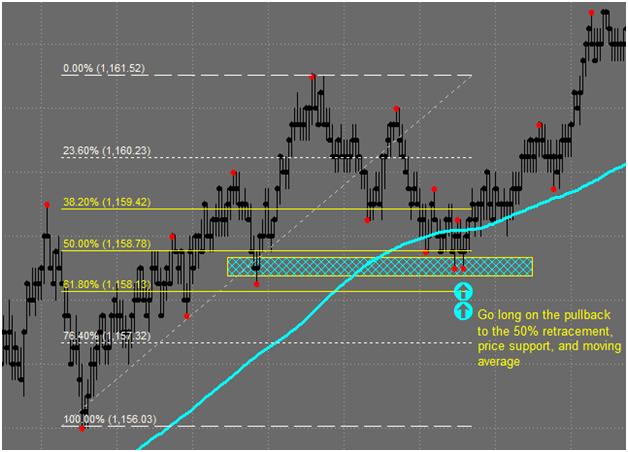
It’s best if you can find multiple areas that line up at the same price that can confirm the area should hold. This can be done by using areas based on simple price structure, indicators, moving averages, and Fibonacci retracements.
In the example below, the market trend is bullish, and the best entry for this trade where we have a confluence of support areas. The best entry area is at the 50% Fibonacci retracement, price support, and moving average. The probabilities of the area holding are greater because it’s in line with the current direction of the market.
Chart 2
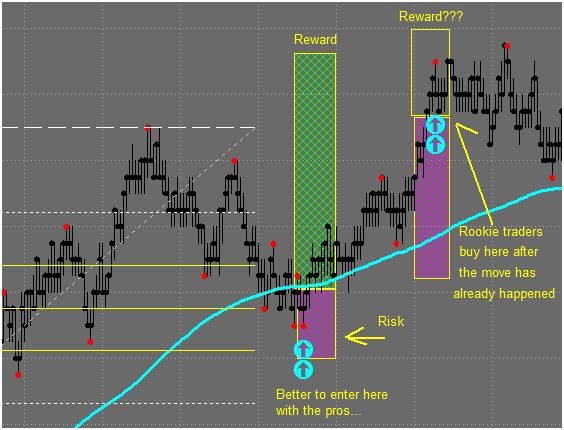
Notice that by getting in on the pullback to the high probability area, we are able to maximize our potential reward and minimize our risk. This is where the professionals will buy, as opposed to the rookies buying after the trade has already played out. We call this pivot-to-pivot trading. Essentially, we are looking to take advantage of the entire run in price.
Chart 3
3. Know when to sit on your hands
A common problem with traders is over trading. If a trader focuses only on indicators and trade signals, they could be missing a very important component which is known as the market environment. There are a few different market environments such as: trending markets, channeling markets, and choppy or indecisive markets. I will trade most market environments except for the periods of time where there’s very low volume and choppy price action, which usually means there’s indecision in the market.
When developing your trading plan, it’s smart to write out different rules based on the market environment you’re currently trading. Keep in mind, the market can shift from different environments many times throughout the day. On short-term charts (like tick charts or 1-5 minute charts), we can see a few trends and channels throughout one trading day. Other times, we’ll see a trend develop in the morning and continue throughout the entire day.
In conclusion, no matter what indicators or analysis you’re using to trade, it’s vitally important to identify a statistical edge in the market. It’s also important that whatever trading strategy you’re trading, you operate in a way that’s comfortable to you. You should be absolutely comfortable with the risk structure and entry/exit criteria for your strategy. In my opinion, it’s best to trade with market direction, don’t try to pick tops, and enter at high probability areas. I wish you the best of luck in your trading!
Chris Dunn is a professional E-mini day trader and the founder of the Emini Academy. Chris specializes in short-term, high probability trading with a strong focus on risk management. He is also known for developing the MAP Trading Strategy which uses rules based trade setups and risk management structures. For more information about Chris Dunn or the Emini Academy, please visit www.eminiacademy.com.


