3 Top PowerRatings Stocks for Traders
For buyers of pullbacks, weakness means opportunity, and one up day in the market has not erased much of that opportunity one bit.
To be sure, the majority of stock traders would be happier if the pullbacks in the market from last week had occurred in a strong market, a market in an uptrend, a market that was trading above its 200-day moving average.
But you trade stocks with the market you have, so to speak, not the market you might want or wish to have at a later time. And the more traders understand and accept that, the more they will be able to trade effectively, regardless of the type of market they find themselves in.
Larry Connors spelled out “the market you have” in a widely-circulated primer called “5 Mistakes to Avoid in a Market Trading Below its 200-day Moving Average“. He expanded on and updated his thoughts on how to trade volatile markets that are below major levels of support in a recent TradingMarkets Teleconference last week (click here to sign up for the next free teleconference on Wednesday April 2). But the principles of dealing with markets under pressure remain the same. And the first rule in that list is arguably the most important one: make sure that the stocks you are buying are above the 200-day moving average.
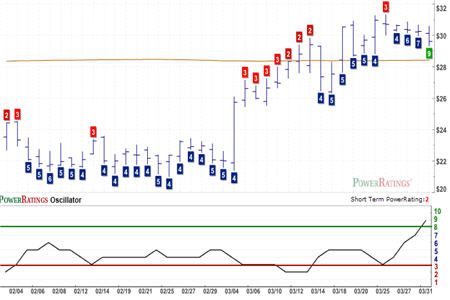
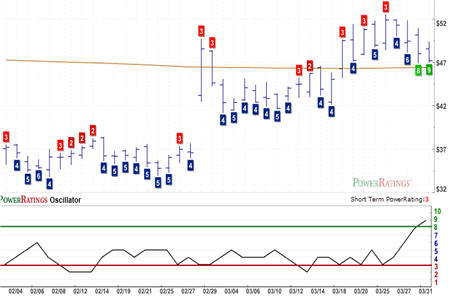
All of the stocks in today’s report have Short Term PowerRatings of 9. This puts all three in that category of stocks that our research indicates are likely to outperform the average stock by more than 13 to 1. Yet, in addition to having high Short Term PowerRatings, all three of these stocks are also trading above their 200-day moving averages. This first filter of making sure that the stocks you are looking to buy are strong stocks, stocks that have climbed and closed above the 200-day moving average can make a critical difference between merely good trades (buying a high PowerRating stock below the 200-day moving average) that may or may not work out and good trades with a high probability of profitability (buying a high PowerRating stock above the 200-day moving average).
In addition to the PowerRatings charts, I have noted the 2-period RSI values for each stock so that traders can see how oversold each of the individual 9-rated stocks is as of the most recent close.
Sun Hydraulics
(
SNHY |
Quote |
Chart |
News |
PowerRating). RSI(2): 9.17

Hurco
(
HURC |
Quote |
Chart |
News |
PowerRating). RSI(2): 8.33

Boston Beer
(
SAM |
Quote |
Chart |
News |
PowerRating). RSI(2): 9.34

Tired of losing money trading breakouts and breakdowns? Our special, Free Report, “5 Secrets to Short Term Stock Trading” will show you some of the key strategies and attitudes that traders throughout history have used to determine the right time to buy and the right time to sell. Click here to get your free copy of “5 Secrets to Short Term Stock Trading”–or call us today at 888-484-8220.
David Penn is Senior Editor at TradingMarkets.com.
