4 bull markets you should know about
Upward Bias Remains as
Seasonals Improve
In August we talked about how September and
October were seasonally the two worst performing months of the year and how
markets often make annual lows in October. Those rough months are over now. In
fact November and December are two of the better months of the year for market
performance historically in the best seasonal time frame for stocks to rally.
And so far the seasonals are proving out. While
we’re not overly excited by the market action and don’t suggest investors become
strongly bullish, the upward bias that started in earnest with the good volume
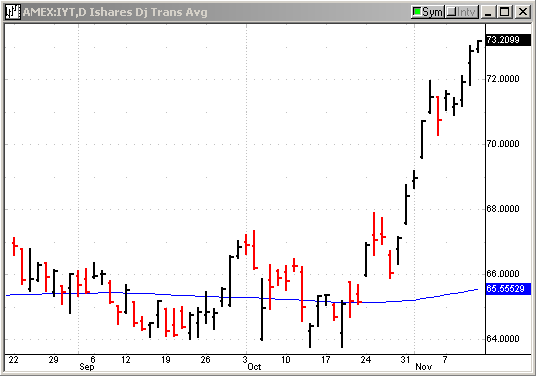
rally of 10/28 is continuing. We continue to like global leaders such as Japan,
US transports, insurance, and Latin Banks on the buy side, and maybe even some
more speculative groups like tech and biotech for BRIEF trading opportunities.
Gold/EUR and Gold/Yen continue to shine, and the Platinum group of metals has
made new highs and broken out of substantial consolidation patterns.
US Dollar Index:

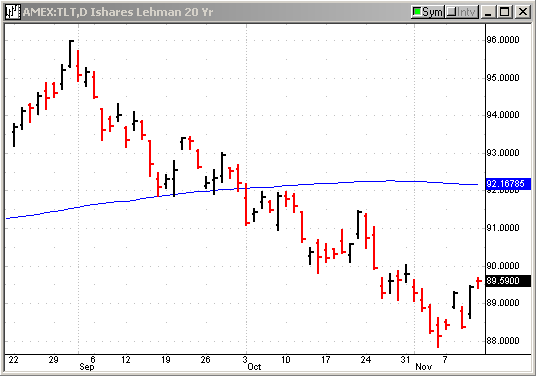
Global bonds have bounced a bit, but we believe
need to confirm rallies by breaking above down-trendlines to give the global
equity rally more breathing room. Bonds thus bear close watching here.

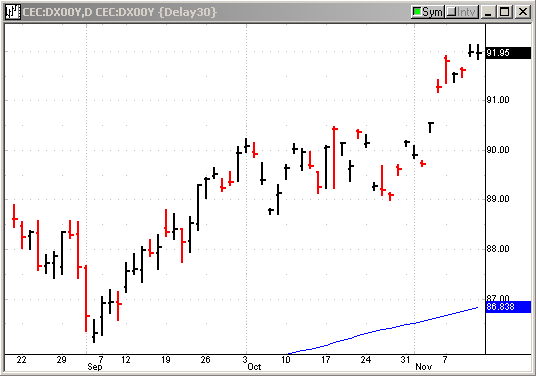
The dollar has broken out to new highs and the
EUR has broken below 1.175 critical support, completing an ominous Head &
Shoulders top that goes back over two years. Upon continuation lower next week,
next support won’t come in until under 1.10.
Oil stocks and oil prices are weak and that is
also helping fuel market gains. The panic reaction to hurricane damage that led
to fears of shortages for the winter in distillates has turned to surprise at
the warm winter weather and lack of problems.
This rally MAY be playable for traders, but
investors should tread more lightly than normal. The bull market is long in the
tooth and not yet a high odds affair that justifies unusually high allocation.
We therefore continue to suggest less than normal allocation, even to the
strongest instruments and sectors.

Our model portfolio followed in
TradingMarkets.com with specific entry/exit/ops levels from 1999 through May of
2003 was up 41% in 1999, 82% in 2000, 16.5% in 2001, 7.58% in 2002, and we
stopped specific recommendations up around 5% in May 2003 (strict following of
our US only methodologies should have had portfolios up 17% for the year 2003) —
all on worst drawdown of under 7%. This did not include our foreign stock
recommendations that had spectacular performance in 2003.
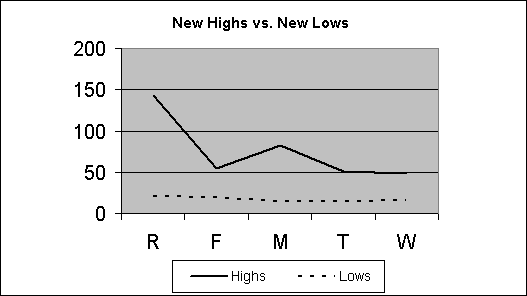
This week in our Top RS/EPS New Highs list
published on TradingMarkets.com, we had readings of 143, 55, 83, 51, and 49 with
44 breakouts of 4+ week ranges, no valid trades and one close call in ITU (a
favorite group as well). This week, our bottom RS/EPS New Lows recorded readings
of 21, 19, 15, 15, and 16 with 11 breakdowns of 4+ week ranges, no valid trades
and no close calls. The “model†portfolio of trades meeting criteria is now long
CVCO and TRAD and short NDN and SUP (tighten stops on shorts). The environment
is getting trickier and more treacherous and we are chickens when it comes to
risking principle unless it looks like the weather is clear.

Mark Boucher
For those not familiar with our long/short
strategies, we suggest you review my book The Hedge Fund Edge. Basically, we
have rigorous criteria for potential long stocks that we call “up-fuel,” as well
as rigorous criteria for potential short stocks that we call “down-fuel.” Each
day we review the list of new highs on our “Top RS and EPS New High List”
published on TradingMarkets.com for breakouts of four-week or longer flags, or
of valid cup-and-handles of more than four weeks. Buy trades are taken only on
valid breakouts of stocks that also meet our up-fuel criteria. Shorts are
similarly taken only in stocks meeting our down-fuel criteria that have valid
breakdowns of four-plus-week flags or cup and handles on the downside. In the
U.S. market, continue to only buy or short stocks in leading or lagging
industries according to our group and sub-group new high and low lists. We
continue to buy new long signals and sell short new short signals until our
portfolio is 100% long and 100% short (less aggressive investors stop at 50%
long and 50% short). In early March of 2000, we took half-profits on nearly all
positions and lightened up considerably as a sea of change in the
new-economy/old-economy theme appeared to be upon us. We’ve been effectively
defensive ever since, and did not get to a fully allocated long exposure even
during the 2003 rally.
Mark Boucher has been ranked #1 by Nelson’s World’s Best
Money Managers for his 5-year compounded annual rate of return of 26.6%.
Boucher began trading at age 16. His trading helped finance his education at the
University of California at Berkeley, where he graduated with honors in
Economics. Upon graduation, he founded Investment Research Associates to finance
research on stock, bond, and currency trading systems. Boucher joined forces
with Fortunet, Inc. in 1986, where he developed models for hedging and trading
bonds, currencies, futures, and stocks. In 1989, the results of this research
were published in the Fortunet Trading Course. While with Fortunet, Boucher also
applied this research to designing institutional products, such as a hedging
model on over $1 billion of debt exposure for the treasurer of Mead, a Fortune
500 company.
