4 E-Minis To Trade Today
Futures Outlook
Great Morning!
Premarket futures are poised to open a
bit higher than Monday’s close. After yesterday’s session results, today holds
solid potential for wide range price moves.
Yesterday’s session was little more than
rangebound rolls between the price levels we figured would contain. ES traded a
6.25pt total range… pitiful lack of volatility. There will come months and
years on end where ES intraday ranges average 15-point to 20-point swings as
witnessed in the past, but that may be awhile. Until then, picking off small
gains and/or keeping chop sessions’ drawdowns small allows us to drive the
equity curves higher when directional sessions emerge.
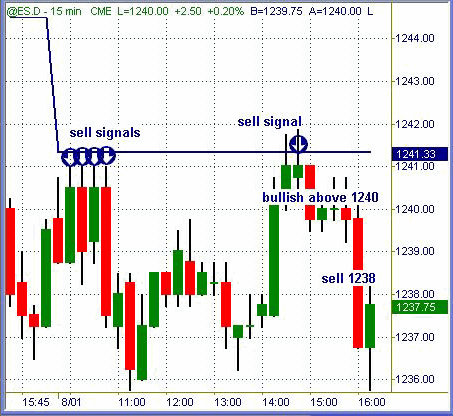
ES (+$50 per index point)

S&P 500 gave an early sell signals from 1241
that went to 1235.75 lows. A second sell signal near 1241 went to 1235.75 again.
Clearly a scalper’s session… this symbol went nowhere at all intraday. I do
not consider a +5pt ES move to be any big deal, and the overall range was
miniscule. Setting us up for a sharp directional break today or tomorrow, for
sure.
Tuesday has initial sell signals below 1238 and
buy signals above 1240 on a candle closing basis to confirm. Anything beyond
there requires intraday observation = measurement of live price action.
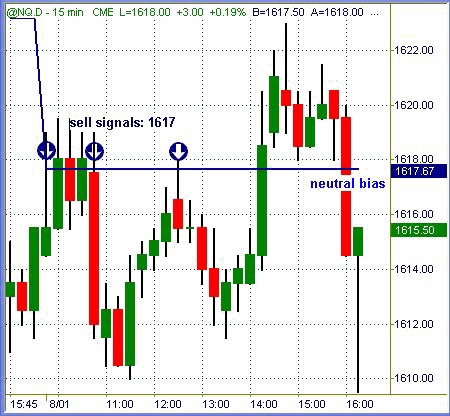
NQ (+$20 per index point)

Nasdaq 100 was a sideways, buzzy mess
yesterday. No bias exists in this chart as we head into today’s active session.
This one also requires real-time observation for new signal alignment setups
before making initial trade decisions today.
A total session range of 14 index points thru
6.5 hours of trading is still inconceivable to me. I traded the NQ (QQQ options)
seriously in years 2000 ~ 2001 when average daily ranges were +/- 100 index
points and initial stops of 20pts were considered tight. What a different world
we live in today! Most current traders do not recall (and cannot fathom)
intraday NQ moves of 200+ points and at least one day of 323 index points from
tip to turn.
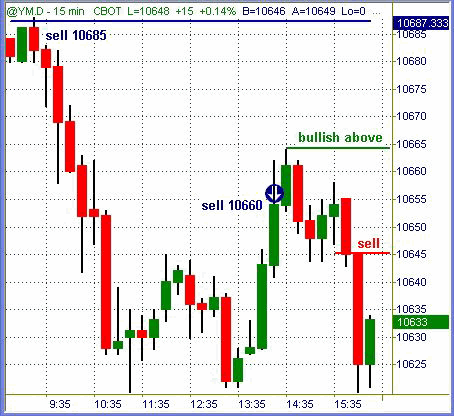
YM (+$5 per index point)

Dow Industrial futures began the day in bearish
territory, and remained there from bell to bell. A couple of sell signals near
10685 and then 10660 offered lunch money profits to the lows. Still on sell
signal near 10645 and bullish confirmed on a candle close above 10665 to kick
off the session.
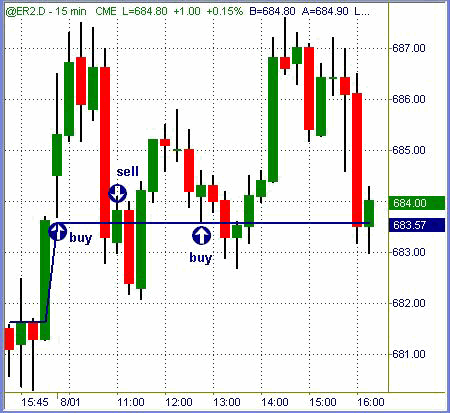
ER (+$100 per index point)

Russell 2000 futures gave a buy signal near
683.80 that went to 687.50 before breaking abruptly lower down to 682. Another
sell signal near 683.50 failed into a midday lift, and a subsequent buy signal
off pivot support worked for a couple of points upside. After that, ER failed at
a triple top (since Friday) near 687+ and fell back to magnetic attraction of
the pivot.Â
This one also begins the day in neutral bias
fashion. We need to see live market prints around key chart signals to see if
the buy side or sell side aligns for us first.
Price levels posted in charts above are compiled
from a number of different measurements. Over the course of time we will see
these varying levels magnetize = repel price action consistently.
Wider View
Each day we’ll switch chart views from 60min to 15min as price action –
behavior dictates. Many of the emails I get each day seem incredulous that
someone would actually trade a chart greater than one minute ~ three minutes in
length. I will always maintain that whatever someone chooses to trade that
proves itself profitable is a fine decision to make. I’ve never been a very
effective scalper… ten trades and a cloud of dust in my account is usually the
result.
My personal efficiency on the scale happens to
be swing trading intraday or over the course of several sessions. There is very
little difference between the two, except pure intraday trading requires more
precise entry points. Regardless, I prefer to take one trade for +$400 profit
instead of five trades for +$100 each and two losses of -$50 each to end up at
+$400 (before costs) in the end.
The method I use will trade any time frame
chart: my choice of trade execution steers me toward 10min charts or equivalent
length for intraday emini trading. To each their own, for sure!
Summation
Monday was basically a consolidation session, especially for small caps and
techs. We should see a directional swing or possibly trend session in the next
day or two, hopefully both. Take the clear signals your method gives without
bias or fear, cut the losers short and let winners run up or down your chart. By
Friday evening, results should be account balance than Monday morning held.
Please Remain Calm When The
Opening Bell Rings
Austin P
free pivot point calculator, much more inside
Austin Passamonte is a full-time
professional trader who specializes in E-mini stock index futures, equity
options and commodity markets.
Mr. Passamonte’s trading approach uses proprietary chart patterns found on an
intraday basis. Austin trades privately in the Finger Lakes region of New York.
