4+ lower lows above 200-day MA and then reversal
With the hundreds of Forex trading strategies out there, all
you need are one or two to be successful at trading. One of the simplest methods is to trade with the current trend. While there is no assurance that past
performance will continue, historically this method has proven to find excellent
candidates to consider trading.Â
First off, we identify the trend using the 200-day simple
moving average.Â
We are going to consider the case of price being above the 200-day simple moving
average as an uptrend. Then we will look for a series of 4 lower lows,
which signifies a pullback. On the following bar we look for a positive
close, which can be taken as an indication that the trend will resume upwards. Let’s look at a few
examples.

From the chart above, we can see that from July to August
the British Pound was sliding against the US Dollar. But the price
continued to stay above
the 200-day moving average (in red), which means that the trend is still up. Next we can see four lower low
closing prices within the blue circled area (1). Then we get a positive close
on the 5th bar (2), which we look to as confirmation that the uptrend is resuming.Â
This sets up for a very nice upside rally in the British Pound through November.

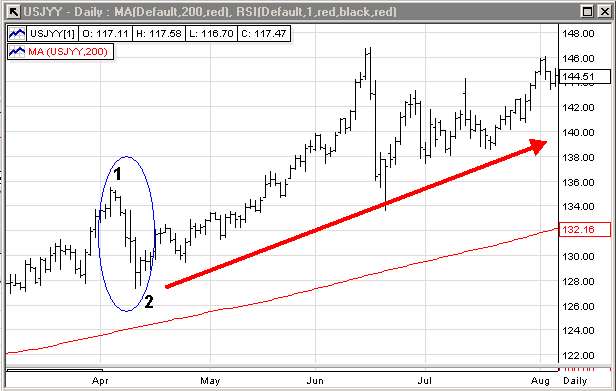
Let’s look at the US Dollar/Japanese Yen for another example.Â
We can clearly see the uptrend up to April before we get 5 lower closing bars
(1). Then we get the first positive close bar (2). The Dollar continues to follow the uptrend and
moves up strongly for the next 3+ months.Â

Here is another example from the British Pound/US Dollar pair.Â
After a sharp 4 day pullback (1), we see a positive close(2), which presents a strong
opportunity for trade entry. These multi-low pullback reversal setups are rare,
but when
they do materialize they present very strong opportunities for traders to get in
on the trend.
Darren Wong
Associate Editor
Â
