4 Overbought Stocks for Traders: BLUD, KB, KERX, PKTR
Yesterday’s light selling did little to reign in a number of stocks that may have moved too far too fast in recent days. These are among the stocks that short-term traders will be targeting on any renewed strength in the market.
One of the more interesting discoveries in our research here at Trading Markets is a price pattern called the “lap.” We have found this pattern to be a key part in letting us know when a stock is exhibiting extreme behavior, behavior that may tell us a great deal about the likelihood of the stock moving higher or lower in the near term.
A lap is very similar to a gap in the markets. A gap, as most traders will recall, occurs when a market opens beyond the high or low of the previous session. For example, if a stock closes on Wednesday at 25.50, with a high of 25.60, and then the next day opens at 25.65, we would say that the stock had “gapped up” at the open.
Similarly, if a stock closed on Wednesday at 30.25, with a low of 30.00, and then the next day opened at 29.90, we would say that the stock had “gapped down” at the open.
A lap up is very much like a gap, only less extreme. Whereas a gap up occurs when a market opens up beyond its previous high, a lap up occurs when a market opens up beyond its previous close, but still below the previous high. And a lap down occurs when a market opens down below its previous close, but above its previous low.
To read more of our research on the difference between gaps and laps, and how both can help you determine whether or not a market is overbought or oversold, click here.
What we found out about both laps and gaps was telling, and goes against some of the conventional wisdom on how this kind of price behavior is best traded.
Our research suggests strongly that when stocks lap or gap up by 5% or more–and are trading under the 200-day moving average–those stocks tend to underperform in one-day, two-day and one-week timeframes. Conversely, when stocks lap or gap down by 5% or more–and are trading above the 200-day moving average–those stocks tend to outperform the average stock in one-day, two-day and one-week timeframes.
As always, context is key. Stocks that gap up or lap up above the 200-day moving average do not underperform, and stocks that gap down or lap down below the 200-day moving average tend to suggest more downside, rather than reversal. But when stocks that are struggling, stocks that are under their 200-day moving averages , gap or lap up, it is often a signal that a final exhaustive move higher has taken place and that the odds for reversal are rising.
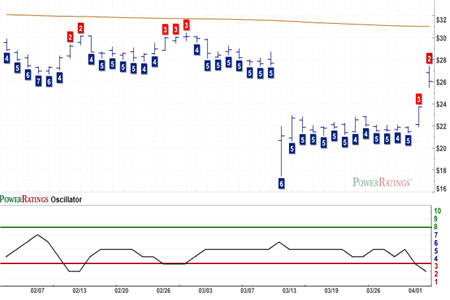
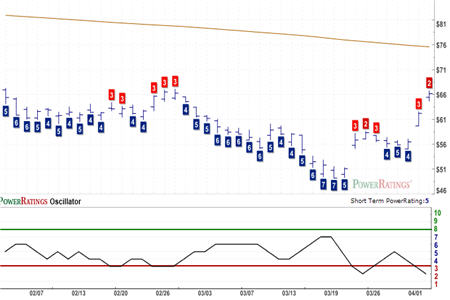
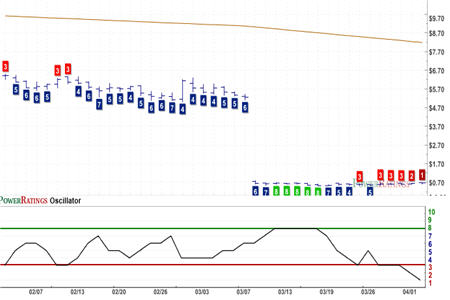
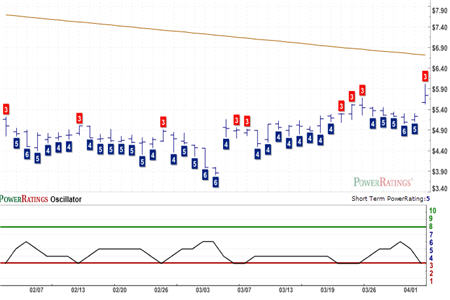
All four of the stocks in today’s report have displayed just these sort of lap ups of more than 5%, meaning all four are increasingly in danger of correction. I have also included the 2-period Relative Strength Index values for each stock so that traders can see just how overbought these names were as of the most recent close.
Immucor
(
BLUD |
Quote |
Chart |
News |
PowerRating). Short Term PowerRating 2. RSI(2): 95.54

Kookmin Bank
(
KB |
Quote |
Chart |
News |
PowerRating). Short Term PowerRating 3. RSI(2): 98.19

Keryx Biopharmaceuticals
(
KERX |
Quote |
Chart |
News |
PowerRating). Short Term PowerRating 1. RSI(2): 96.56

Packeteer
(
PKTR |
Quote |
Chart |
News |
PowerRating). Short Term PowerRating 3. RSI(2): 92.24

For more simple and straightforward tips on short-term stock trading, consider getting a copy of our free report, written especially for those who trade stocks in the short-term “sweet spot” of five to eight days. Click here to get your copy of “5 Secrets to Short Term Stock Trading Success”–or call us at 888-484-8220–and see what the TradingMarkets approach to trading can do to make you a better trader.
David Penn is Senior Editor at TradingMarkets.com.
