4 Rules to Time the Market Using the TRIN
The TRIN is a very popular indicator published in the Wall
Street Journal, Investors Business Daily, Barron’s, and by a number of websites.
Considering just how popular it is, we find it surprising that there are very
few statistical studies to show whether it actually works or not, and how to use
the TRIN effectively.
The most common interpretation of how to use the TRIN suggests
a reading below 1.0 is bullish and a reading above 1.0 is bearish. Our own
research into how to use the TRIN has shown it to be a very useful indicator but
it also revealed that using it in this way simply doesn’t work.
We have built a number of
successful trading systems that quantified different ways of using the TRIN. In
this article we’re going to teach you a quantified trading strategy for use with
the SPY’s (S&P 500 Depositary Receipts), E-mini (S&P 500), options, and other
vehicles you use to trade the overall direction of the market. But, before we
get to the strategy, here’s some background on the TRIN and how it’s
calculated…
What is the TRIN?
The TRIN was developed by Richard Arms in the 1970’s and is
sometimes referred to as the Arms Index. It calculates the relationship of
volume in advancing issues to volume in declining issues, with the basic concept
being that in a rising market we want to see more volume in advancing issues
than declining issues (the opposite being true of a declining market).
Here’s the formula:

A ratio of 1 means the market is in equilibrium;
above 1 indicates more volume in declining stocks; and below 1 indicates more
volume in advancing stocks.
A Quantified Way of Using the TRIN
There are numerous ways to use the TRIN to help
time your trades for the SPY’s, E-mini’s, options, etc. Here’s one simple
strategy which you can apply to your trading immediately.
-
The SPY’s (SPY) are above the 200-day simple
moving average. -
The TRIN closes above 1.0 three consecutive
days. -
On the day this happens, buy the market on
the close. -
Exit when the SPY’s close above their 5-day
simple moving average.
Since the launch of the E-minis in September
1997, this has happened 74 times. 72% of the time, the market closed higher
using the above rules. To put this in perspective, the market has closed higher
five days later (from every trading day) 57% of the time when it’s been above
the 200-day MA. By waiting for the TRIN to close three days in a row above 1.0,
your edge jumps to 72%, a large improvement. The average hold for these signals
has been less than five days.
The drawback to the above is that it has only
signaled 74 times and been in the market about 300 total days. But, you take
this one method, and start combining it with dozens of other methods, and you
start seeing the makings of a market timing methodology that can guide you on a
day to day basis.
Recent Trades
Example 1

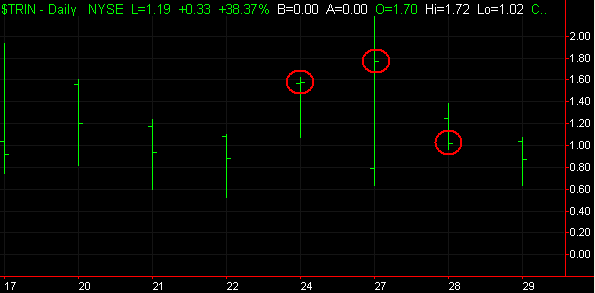
The TRIN closes above 1.0 three consecutive days
on 11/28/06.

The SPY is trading above its 200-day MA (not shown). Buy the SPY on the close
11/28/06, exit the next day when the SPY closes above its 5-day MA (blue line).
Example 2

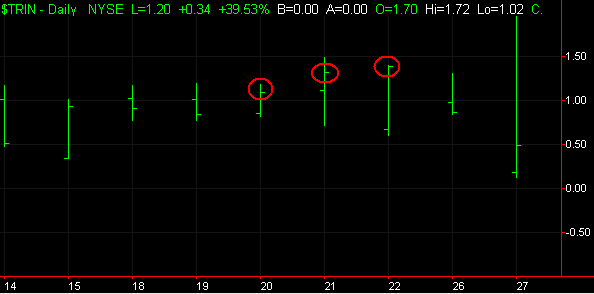
The TRIN closes above 1.0 three consecutive days
on 12/22/06.

The SPY is trading above its 200-day MA (not
shown). Buy the SPY on the close 12/22/06, exit on 12/27/06 when the SPY closes
above its 5-day MA (blue line).
In the upcoming weeks, we’ll continue to publish
more research on the TRIN, along with other research including additional
research from last week’s article on the
2-Period RSI (many thanks for all the great emails you sent).
Please feel free to send me any questions or
comments you may have.
Ashton Dorkins is
Editor-in-Chief of TradingMarkets.com.
Larry Connors is CEO and Founder of TradingMarkets.com,
and Connors Research.
Learn more strategies like this in the “TradingMarkets
S&P Market Timing Course for E-mini and Options Traders“. To listen to a
free Market Timing presentation led by Paul Sabo and Larry Connors,
click here.
