5 reasons why the market is going higher
The major
indexes showed continued strength last week, as both the S&P 500 and the NASDAQ
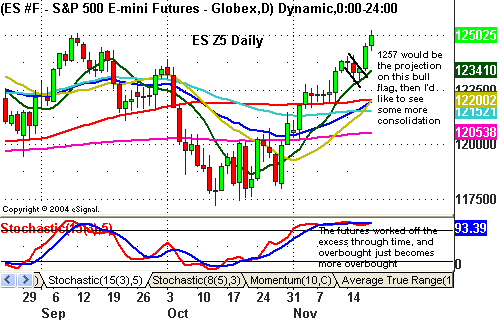
were able to finish at fresh 4½ year highs. Over the first 3 sessions of the
week, equities consolidated the recent rally in textbook fashion. Relative
weakness was seen in higher beta issues, which ended up being normal
profit-taking.
However, things then changed on Thursday when a sharp drop in
energy prices triggered a powerful Tech rally late in the session. We saw good
follow-through on Friday, which allowed the indexes to finish the week near
their highs. Internet and Chip shares were the upside leaders, while
under-performance was again seen in Energy names. It’s also worth noting that
gold finished at a new 18 year high and that crude oil continued its downtrend.

There is no
denying the fact that the recent action in equities has been extremely bullish.
First, stocks traded sideways for 5 sessions during a short-term overbought
condition. Anytime a market is overbought and doesn’t go down is simply a good
sign of underlying strength. Next, also note that the recent rally has been led
by growth-orientated sectors such as Internet, Chip, and Financial shares, which
is normally a bullish sign for the economy. This is different than the
energy-led rallies over the last 18 months.
Finally, the breakout patterns seen
in indexes such as the S&P 500, the NASDAQ Composite, and the Dow Jones
Transportation Index have really been eye openers. While I still remain
concerned over the Fed continuing their tightening cycle, especially with a
Greenspan clone stepping up to the plate early next year, the action from
equities is strong enough to suggest that something very positive is around the
corner (i.e. the Fed standing down on rates). Then again, it’s always possible
that the recent gains are nothing more than fund managers trying to save their
jobs and chasing high-beta names into year-end.
Daily Pivot Points for 11-21-05
Â
| Symbol | Pivot |
R1 |
R2 | R3 | S1 | S2 | S3 |
| INDU | 10753.28 | 10809.31 | 10852.29 | 10908.32 | 10710.30 | 10654.27 | 10611.29 |
| SPX | 1246.19 | 1251.66 | 1255.06 | 1260.53 | 1242.79 | 1237.32 | 1233.92 |
| ES Z5 | 1248.33 | 1254.17 | 1258.08 | 1263.92 | 1244.42 | 1238.58 | 1234.67 |
| SP Z5 | 1248.30 | 1254.10 | 1258.00 | 1263.80 | 1244.40 | 1238.60 | 1234.70 |
| YM Z5 | 10764.33 | 10813.67 | 10845.33 | 10894.67 | 10732.67 | 10683.33 | 10651.67 |
| BKX | 684.80 | 687.80 | 690.73 | 693.73 | 681.87 | 678.87 | 675.94 |
| SOX | 477.43 | 482.04 | 485.61 | 490.22 | 473.86 | 469.25 | 465.68 |
Weekly Pivots for the Week of 11-14-05
Â
| Symbol | Pivot |
R1 |
R2 | R3 | S1 | S2 | S3 |
| INDU | 10738.29 | 10824.30 | 10882.28 | 10968.29 | 10680.31 | 10594.30 | 10536.32 |
| SPX | 1241.42 | 1256.43 | 1264.59 | 1279.60 | 1233.26 | 1218.25 | 1210.09 |
| ES Z5 | 1243.67 | 1258.83 | 1267.42 | 1282.58 | 1235.08 | 1219.92 | 1211.33 |
| SP Z5 | 1243.67 | 1258.73 | 1267.27 | 1282.33 | 1235.13 | 1220.07 | 1211.53 |
| YM Z5 | 10750.33 | 10827.67 | 10873.33 | 10950.67 | 10704.67 | 10627.33 | 10581.67 |
| BKX | 103.01 | 104.55 | 105.41 | 106.95 | 102.15 | 100.61 | 99.75 |
| SOX | 472.78 | 486.69 | 494.92 | 508.83 | 464.55 | 450.64 | 442.41 |
Please feel free to email me with any questions
you might have, and have a great trading week!
Chris Curran
Chris Curran started his trading career at the
age of 22 with a national brokerage firm. He combines fundamentals and
technicals to get the big picture on the market. Chris has been trading for 15
years, starting full time in 1997, and has never had a losing year as a
full-time trader.
