6 indicators to find hidden strength
The overall market has
undeniably been a bit rocky so far this month. These are the returns,
without dividends, of the major indexes for February (to date):
Dow Jones Industrial Average
(
.DJI |
Quote |
Chart |
News |
PowerRating) -.31%
S&P 500
(
.SP500 |
Quote |
Chart |
News |
PowerRating) -1.02%
Nasdaq Composite
(
COMP |
Quote |
Chart |
News |
PowerRating) -1.90%
NYSE Composite
(
NYA |
Quote |
Chart |
News |
PowerRating) -1.55%
Russell 2000
(
RUT |
Quote |
Chart |
News |
PowerRating) -2.19%
S&P 600 Small Cap Index
(
.SP600 |
Quote |
Chart |
News |
PowerRating) -2.55%
It is interesting to note that the Dow Jones, which has been the laggard, has
held up fairly well. Also, it has regained its’ position above its 50-day simple
moving average, whereas both the S&P 500 and the NASDAQ are still trading below
their 50 days (the SML, RUT, and NYA have remained above their averages during
the recent decline and are still above them). Are blue chips finally going to
make a comeback? This is something to keep monitoring.
What else should we be looking for to indicate that this is more than a normal
pullback from overbought conditions? The shorter-term breadth indicators, such
as the percent of stocks on the New York Stock Exchange trading above their
50-day moving averages and the percent of stocks trading above their 150-day
moving averages now have negative trends.
Also of interest is the fact that the Bullish Percent of the S&P 500 now has a
negative trend. Bullish percent indexes are a type of breadth indicator that
measure the number of stocks on the S&P that are on Point and Figure Buy
Signals. In the Point and Figure methodology, a buy signal is a column of Xs
rising above a previous column of Xs. The last time the Bullish Percent of the
S&P 500 turned negative was in September of 2005, and it did not reverse back to
positive until this past November. The return on the S&P 500 for September 1,
2005 to October 31, 2005 was (1.19%).

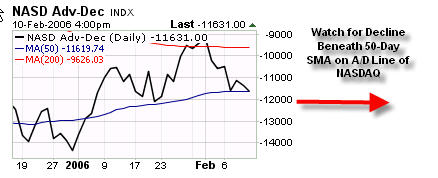
What is interesting, however, is that the New York Stock Exchange Composite
Index (NYA), which is a very broad index, has good support at 7920. Recently,
the market was able to bounce off of that level for the third time. In addition,
the Advance Decline line for the NYSE seems to be holding at a key support
level, and the Advance Decline line of the NASDAQ composite is still holding
above its’ 50-day simple moving average.

To me, this is a mixed picture, but I still remain fairly bullish on the overall
market. Should the NYSE Composite break to 7900, and the A/D lines start to
deteriorate, I would become more bearish.
Sara Conway is a
registered representative at a well-known national firm. Her duties
involve managing money for affluent individuals on a discretionary basis.
Currently, she manages about $150 million using various tools of technical
analysis. Mrs. Conway is pursuing her Chartered Market Technician (CMT)
designation and is in the final leg of that pursuit. She uses the Point and
Figure Method as the basis for most of her investment and trading decisions, and
invests based on mostly intermediate and long-term trends. Mrs. Conway
graduated magna cum laude from East Carolina University with a BSBA in finance.