6 Oversold Stocks with Upside for Traders
Do you buy stocks when they are down, or after they’ve already moved up?
Plenty of traders only buy stocks after they’ve advanced. Some of them are momentum traders who like to jump on the moving train of a price breakout. But many of these traders are not momentum traders so much as they are nervous traders who need the reassurance of seeing other traders buy the stock before they feel the confidence to commit their own capital.
Much of what we teach in our TradingMarkets Path to Professional Trading course (click here
for free registration) is geared toward breaking that latter group of traders out of that habit. Our approach, simply put, is to buy weakness and to sell strength. So while the momentum trader buys near the highs of a successful breakout, the TradingMarkets trader is more likely to buy on the almost-inevitable pullback or, if the stock fails to pullback, to wait for a better opportunity in which he or she can buy low and sell high.
Our research tells us that there is a quantifiable edge in the short-term by trading stocks this way: by identifying pullbacks in otherwise strong stocks, buying those pullbacks, and then selling those stocks as they recover and resume moving higher.
In order to do this, there are two things those trading pullbacks need to determine. The first is what constitutes an “otherwise strong stock.” The second is what constitutes a pullback.
To answer the first question, we use the 200-day moving average.
Stocks trading above their 200-day moving averages are considered to be in generally good to strong shape. Stocks trading below their 200-day moving averages, on the other hand, are not to be bought for short-term trading purposes. These are weak stocks, generally speaking, that will often fool traders into buying them by displaying temporary and fleeting strength.
To answer the second question about identifying pullbacks, there are a number of conditions and tools that traders can use. One simple observation traders can make is whether a stock is down 10% or more from its most recent close. Our research into stocks that are down 10% or more (which you can read
tells us that these stocks actually have positive returns in one-day, two-day and one-week time frames. When trading above their 200-day moving average (remember, we want strong stocks in pullbacks, not weak ones), these stocks can provide a potent edge in the short-term for traders.
Below is a list of six stocks that are trading above their 200-day moving averages, are dramatically oversold and are also down 10% or more from their last close. I am also noting the 2-period Relative Strength Index (RSI) values for each, along with their 100-day Historical Volatility. The 2-period RSI is another tool for determining how oversold a stock is (the lower the more oversold).
The 100-day Historical Volatility tells traders how much volatility or movement the stock has exhibited, with higher values reflecting the likelihood of greater movement in the stock compared to others with lower values.
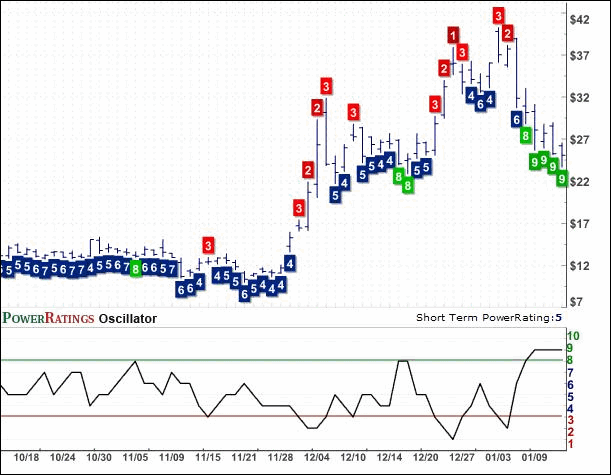
Solarfun Power Holdings
(
SOLF |
Quote |
Chart |
News |
PowerRating). RSI(2):
1.58. HV(100): 119.09

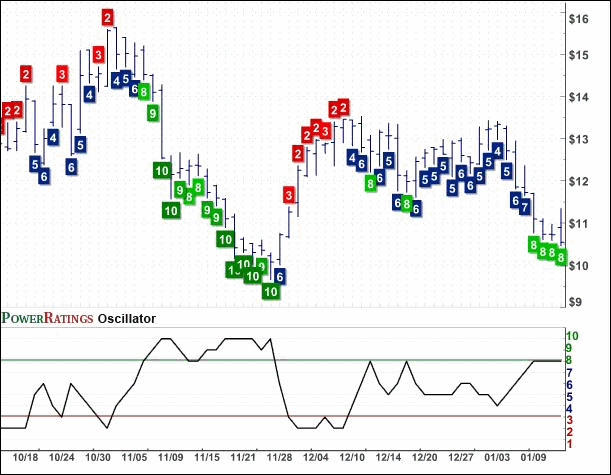
Rick’s Caberet International
(
RICK |
Quote |
Chart |
News |
PowerRating). RSI(2):
3.59. HV(100): 68.49
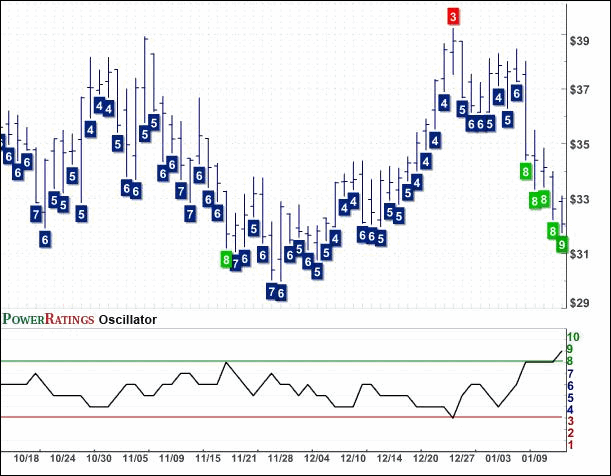
Netscout Systems Inc.
(
NTCT |
Quote |
Chart |
News |
PowerRating). RSI(2): 0.80.
HV(100): 61.32

Mastercard
(
MA |
Quote |
Chart |
News |
PowerRating). RSI(2): 0.11. HV(100): 50.95
Kaman Corporation
(
KAMN |
Quote |
Chart |
News |
PowerRating). RSI(2): 0.42.
HV(100): 45.17

Brasil Telecom S.A.
(
BTM |
Quote |
Chart |
News |
PowerRating) RSI(2): 35.80.
HV(100): 57.03
