6 ways to enter these wild swings
1987 = 2005
Eighteen years ago, Black Monday was
one for the all-time record books. Wednesday’s session was likewise a session
for more recent record books. A 27-point intraday range in the ES, 21-point
total span in the ER. Certainly there were a lot of catalysts to spark such a
key reversal move, some of which are detailed below.
ES (+$50 per index point)
S&P 500 tested previous lows early this
morning, then built steam midday before catching absolute fire on a +27 point
launch to closing highs. Suffice it to say that shorts were burnt to a crisp,
and high open interest on index put option contracts probably had much to do
with this inferno.
From years 2000 – 2002 I traded index options
very aggressively during expiry week, and these were the sessions we fantasized
about. October call options rose from +500% to +900% lows to highs today,
depending on which strike was played. Not too difficult to pick off some profits
from the middle of those swings.
Price action closed right at 1200 in precise
fashion. That may be a mark targeted to pin thru Thursday’s closing bell if
possible. Tons of unrealized gains were wiped out of index put options today…
and the market makers would like to keep it that way.

ER (+$100 per index point)
Russell 2000 halted right at 640 round number
in suspicious fashion. That also marks the 38% retracement of most recent hi to
lo swing… and it was done inside of 1/2 session to boot. next visible magnet
above is 647 followed by 655 on the high side.

Thursday Session:
ES (+$50 per index point)
S&Ps have 1191 as lowest level of support on Thursday, which
might actually mark session lows if touched. Should the index open higher and
run to upper resistance first, expect any selloff to end at this value or
higher.

ER (+$100 per index point)
Russell has lower levels of containment near
632+ going into the next session ahead. Overhead resistance levels are visible
in the bigger swing trade charts profiled above.

Reality In Real Time
Yesterday is the type of trading session where people look back in hindsight
and clearly see buy signals all the way upward. In my case I was actually long
from ER 619.50 to 627.50 and then again from 632+ to 637+ toward the closing
bell.
Earlier I had been short off the open and
stopped out for -1.0pt as price action peaked 1.3pts above my entry before
dropping several points in what would have been my favor. Also, I added to my
long position off the double bottom near 623 and got stopped out by a couple of
ticks before the squeeze caught fire right from there.
It was a very good day for me, but had a couple
things worked differently it would have been a monstrously profitable session.
Hindsight shows everything with crystal clarity: trading in real time is always
a different story.
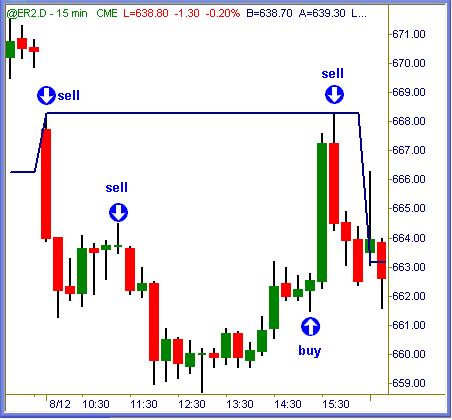
On August 12th we had a similar session in the
markets where price action opened lower, spiked upward off econ news, sold down
to new session lows and popped in relief. This is almost the exact same
structure in chart action that we saw yesterday… with one notable exception.
See what happened when price action hit pivot resistance here? End of the
squeeze, with emphasis. Who was to know yesterday that the same process would
not be repeated again?

Sometime in July 2005 we had a session that
opened above its pivot point, dropped -$500 per contract to that support, posted
a perfect session low to the tick on that mark and rallied +$900 per contract to
new session highs. Along the way I see several clear long trade signals that
each went for solid profits. Clear, structured, methodical price action that’s
(relatively) easy to trade.
Yesterday in our educational room I cautioned
everyone but the most aggressive traders who could tolerate choppy conditions to
stand aside. Why? One look at the intraday charts until 1:30pm EST shows nothing
but volatile, sideways price swings. There was no trend structure up or down to
gauge bias from. We could have just as easily seen drop to new recent lows as
the firestorm upside that unfolded.
August 12th and October 19th were the
exact-same sessions until pivot resistance was broken with emphasis yesterday
past 2:00pm EST… whereupon the bulk of session gains in both indexes well past
3:00pm EST.
I’m sure a lot of traders kept shorting and
shorting into the remarkable ascent, because that’s exactly what it takes to
fuel such a move. It is equally true that sellers might step back a bit, but
have not forgotten the overall direction of this recent past.
Once the long side got cookin’ on Wednesday,
there was nothing but buy signals most of the way. A quick pause below daily
pivot points in the ES and ER were sensible short locations, but after those
lids
broke with gusto we saw continued long signals upward from there.
It was one of those sessions where incredible
profits are available, but most traders are content to book average gains. Why?
Such sessions come along so rarely, it is hard to keep buying and buying all the
way up without saying to oneself that enough is enough. Some traders hit every
signal from bell to bell, and they experience wider equity swings on both ends
than traders with preset loss limits and acceptable intraday profits accrued as
well.
Moral of the story? Don Miller’s (always
excellent) video on Wednesday
here includes a statement at the end about being in/out of synch with
any given session regardless of all else. Yesterday was a most unusual event
fueled by a unique set of circumstances. Traders should focus on being
profitable each day possible and limit losses in sessions that are not. Wide
range events such as the previous session can offer unusual profit potential,
but are not necessarily easier to trade than others. The countless traders who
made money shorting yesterday’s drop and subsequently got hammered shorting into
the afternoon ramp know exactly what I mean. For my money, give me the straight,
gentle trend sessions like example from July above every single day of the week!
Summation
Wednesday’s reversal session may / may not be one that sticks. We’ve
seen bigger one-day wonders than this thru the bear market period of old. I have
no opinion of what will happen over the long haul. It can be said that high put
option ratios fueled the squeeze to unusual proportion. Price action is at key
inflection points of resistance, but a lot of stubborn bears are exhausted from
selling into yesterday’s steamroller. With index option expiry at hand today and
equity option expiry tomorrow following wild swings from Wednesday, we might see
some sideways market pins in place.
As always, take the clear trade signals and let
odds of probability work in favor from there. Everything else is incidental,
when we actually stop and think about it. Â
Trade To Win
Austin P
(free pivot point calculator, much more inside)
Austin Passamonte is a full-time
professional trader who specializes in E-mini stock index futures, equity
options and commodity markets.
Mr. Passamonte’s trading approach uses proprietary chart patterns found on an
intraday basis. Austin trades privately in the Finger Lakes region of New York.