Adjusting Stops For Volatility
As an intermediate-term trader, I
prefer to use a fixed initial price stop of 5% when I buy into a new position.
This simple mechanism allows me to keep the majority of my positions at the same
dollar value on entry.
However, there’s no reason that an
advancing stock has to obey my 5% rule. If I believe a stock’s normal volatility
exceeds my 5% stop, I may relax my stop to allow for more breathing room. But I
will not relax my risk management. To the extent I relax the stop, defined as a
percentage of my cost, I will reduce my position size accordingly.
Before going into this technique, let
me ask this question: Are you successful using a fixed initial protective stop?
If so, think twice before departing from a proven approach. If a stock just
looks too volatile to tolerate your stop, consider looking elsewhere for your
trades.
We all have got stopped out of new
buys only to see the stock head higher right after throwing us into cash. It’s
impossible to avoid some stop-outs in trading. So accept these small losses as
part of the price of doing business.
One way to deal with this is to stick
with your stop-loss rule, accept the loss, but buy back in if the stock sets
back up and heads north. For more on this approach, check out Greg Kuhn’s
lesson, Handling
Breakout Whipsaws.
That said, you can adapt your stops to
take into account greater volatility around your pivot or entry point. I have no
magic formulas. Use the volatility measures that work best for you. I look at
the chart of each stock myself and make my own eye-and-gut determination as to
whether my normal 5% stop will suffice.
For those of you who would like to
investigate volatility further, see Dave Landry’s three-part series
to Volatility,
Volatility and
In Action.
Position Stops And
Account Stops
Whenever I trade, I mentally have two
stops: a position stop and an account
stop. The position stop is simply the maximum that I will allow the
share price to move against my trade, beyond which I will sell my buy or cover
my short.
As I said above, I use a 5% stop in
most cases. Under this stop, I will allow a new buy to fall no more than 5%
below my cost. Beyond that point, I sell. Before buying a new stock, I may
choose to use a wider stop, say 10%, if I think more breathing room is
necessary.
In either case, once a stop is
decided, I stick with it. I don’t, for instance, set a 5% stop, then if the
stock falls below that level, make excuses and change the percentage to give the
stock more time to prove me right. When the market proves me wrong, I accept the
market’s verdict and liquidate.
My account stop is not subject to
revision under any circumstances. The account stop is simply the maximum
allowable loss in any given position expressed as a percentage of my total
account value.
Let’s say that I set my account stop
at 1% and my account value is $100,000. The maximum allowable loss in any
individual position is $1,000 (.01 X $100,000).
Imagine that I buy a stock that
appears to have “normal” volatility under my personal trading regime.
I would use my 5% position stop. I would buy no more than $20,000 in the stock.
This maximum position size represents the intersection of my position stop and
my account stop. To find your position size, simply divide your maximum
allowable loss by your position stop. In this case, the calc is $1,000/.05,
which yields $20,000.
Now let’s say that I decide to buy a
different, more volatile stock. Because of the greater volatility, I choose a
wider position stop of 9%. While the position stop has changed, my 1% account
stop remains inflexible. So I must reduce my maximum position size accordingly.
I will buy no more than $11,111 of the stock ($1,000/.09).
Fixing Stops
According to Support
One way that I like set stops is by
looking at the chart, find a support level and setting my stop slightly below
that support level. Then I size my position to keep the maximum loss within the
bounds of my 1% account stop.
Choose the support levels that work
best for your style of trading, then calculate the percentage from your position
share price to the identified support level to get your percentage position
stop. Then divide maximum allowable account loss by percentage position stop to
get your maximum position size.
To see how this works, imagine that
you’re contemplating a possible breakout in Yahoo in 1997. (Apologies for the use
of decimalized prices. This chart was created post-splits.)
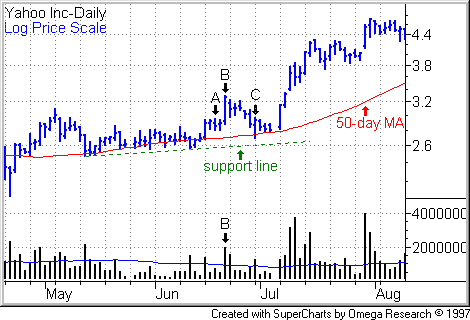
Let’s make some other assumptions. You
have $50,000 in your account. Your maximum allowable loss as a percentage of
your account is 1.5%. So the dollar value of your maximum loss in any trade is
$750. (.015 X $50,000).
You’re watching Yahoo when, on June
18, 1997, the stock sets the price high of a handle structure at 2.948 a share,
which we’ll use as our pivot point (see Point A
in the above chart). Assume that you decide that if Yahoo takes out that high,
you’ll buy.
In order to plan ahead for your
position stop and position size, you must make an assumption about what price
you’ll get in. You assume that you’ll get in at 3.04 a share. This represents 3%
beyond your pivot. Because you’re a vigilant trader with a brokerage that
provides excellent order execution, you usually get in much closer to the pivot.
So an assumption of 3% price extension represents a conservative estimate on
your part.
Looking at Yahoo’s chart, you notice
the stock has found support in a relatively tight trading range in the prior
weeks. You extend a trend line along the lows beneath the price handle (see green
dotted line in chart). You decide this notional line will define a
probable support area. A cross below this line, in your view, will represent a
bearish shift in the stock’s character, and you’ll sell. (No excuses, now. If
the stock hits your sell your rule, you’ll sell!)
Using this line, you decide to set
your position stop at 2.6 a share, or 14.5% below your presumed purchase price.
Now you have enough information to figure out a position size that (1) gives
Yahoo enough breathing room according to your view of where the stock should
find support while (2) keeping your exposure within your maximum risk tolerance
of a $750 drawdown to your account before you run to cash. Just divide your
maximum loss ($750, in this case), by your percentage position stop (.145). You
get a maximum position of $5,172.
Assuming you get in at a share price
of 3.04 or less, a 14.5% decline in a $5,172 position would represent a $750
loss or less to your account. Now you know, in advance of the breakout, how much
stock you will buy.
Don’t wait until a breakout occurs to
calculate your position size from the prevailing best ask price. You won’t have
time. While you’re fumbling with the math, the share price could move higher. In
fact, it should move higher rapidly if you’ve spotted a valid breakout. The key
to exploiting breakouts is rapid order execution. Form or refresh your estimates
before the market opens, and prepare to act quickly.
Yahoo shares broke out on June 20,
closing at 3.271 on double normal volume (see Point B).
Let’s assume you got in at 3.04 a share. Thereafter, the stock lost ground, drifting lower, then spiking lower on June
30, marking an intraday low of 2.703, before recovering to close near the high
of the day’s trading range (Point C).
In this example, your stop kept you in
a winning position. Your maximum price low of 2.6 was never touched. After the
June 30 shakeout, Yahoo headed north.
For The Best Trading
Books, Video Courses and Software To Improve Your Trading