Ascending Breakouts
Markets can act sloppy around bottoms,
and that can translate into some choppy patterns. I avoid wide-and-loose
patterns. However, some patterns can still give you a crisp entry if the price
structure sets up a pivot before the breakout.
In particular, bases can fail but
quickly form new bases as the general market tries to come off it its lows, runs
into selling, backs and fills, then forges ahead.
You can see this kind of action in
Cadence Design Systems
(
CDN |
Quote |
Chart |
News |
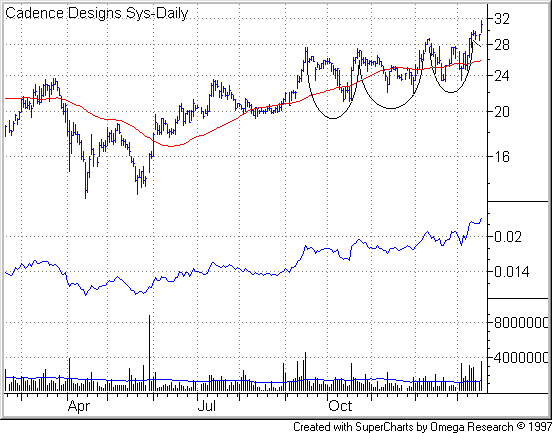
PowerRating). The stock Wednesday jumped 1 9/16 to a new
high of 31. In the process the stock sprang from a sort of ascending
base with a high handle.

This is a perfectly sound formation.
In the above chart, I’ve underlined each basing zone with black arcs. Notice how
the trough of each ensuing base bottoms higher than the prior base’s trough.
Notice also confirming move by the relative strength line into new high ground.
Often, an ascending structure will
complete and breakout out of a cup-with-handle structure as the final base in
the series. I previously noted this phenomenon in the Jan.
3 breakout of American Eagle Outfitters
(
AEOS |
Quote |
Chart |
News |
PowerRating). Like AEOS, the
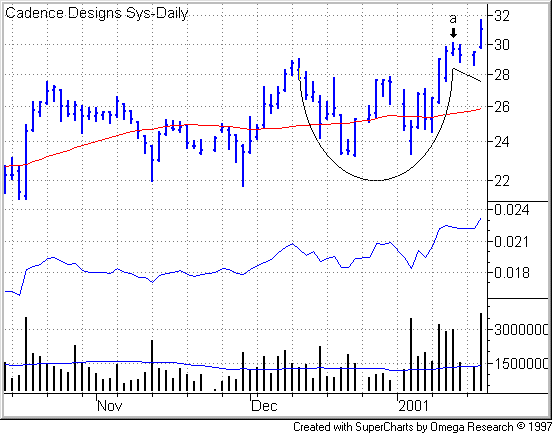
Cadence Design Systems cup-with-handle stretches five weeks in length. That’s a
tad short but still longer than the warning by William O’Neil, expressed in his
newest book, 24 Lessons for Investment Success,
to avoid bases of four or fewer weeks in length.
Let’s take a closer look of Cadence’s
pattern.

Note powerful volume expansion and
upper-range close on the breakout. That bodes well for an ensuing uptrend.
Assuming you traded off the handle, your buy point would come when the stock
exceeded the Jan. 11 high (see Point a in
above chart) by 1/8 point.
The stock also broke out on a gap-up
price move, a bullish omen noted as long ago as 1932 by Richard Schabacker in Technical Analysis and Stock Market Profits, the standard technical analysis reference until the publication of Edwards and Magee’s Technical
Analysis of Stock Trends in 1948. Schabacker observed that a gap
breakout from an established pattern constitutes “prima-facie evidence that
a drastic change has taken place in the technical position of a
stock.”
To play matters safe, heed well
Schabacker’s 70-year-old advice that the gap-up price move should coincide about
an established “technical formation” (i.e., consolidation pattern or
support level) to qualify as a “break-away gap” into a new uptrend. If
the gap occurs after the stock has extended far in price, this could represent
an “exhaustion gap,” presaging a hard reversal. For an example of an
exhaustion gap, see the E-Trade Group
(
EGRP |
Quote |
Chart |
News |
PowerRating) and Charles Schwab
(
SCH |
Quote |
Chart |
News |
PowerRating)
charts in my lesson on climax
tops.
For more on gaps, see Gary Kaltbaum’s
lesson on gap
trading strategies.
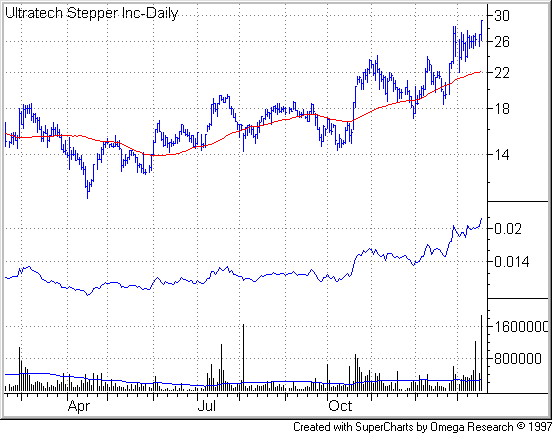
In another breakout, Ultratech Stepper
(
UTEK |
Quote |
Chart |
News |
PowerRating) surged 2 3/16 to 29 3/16 on tremendous volume. Note again the RS
line confirmation. On breakouts, I want to see the RS line move to new high
ground on or before the breakout.

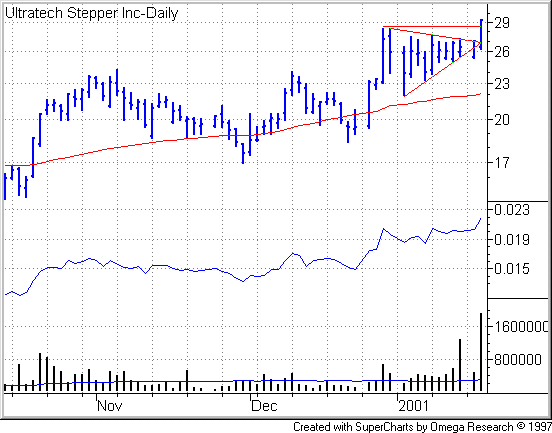
Here’s a closer look. In this case,
the final basing zone forms a triangle-like structure, drawn either as an
ascending or symmetrical variant.

The top field of all charts in this
commentary uses a logarithmic price scale and displays a 50-day price average in
red. In the second field, a
blue relative strength line represents the displayed security’s price
performance relative to the S&P 500. The third field displays vertical daily
volume bars in black with a 50-day moving average in blue for volume.
All stocks are risky. In
any new trade, reduce your risk by limiting your position size and setting a
protective price stop where you will sell your new buy or cover your short in
case the market turns against you. For an introduction to combining price stops
with position sizing, see my lesson,
Risky Business. For further treatment of these and related topics,
you’ll find extensive lessons in the Money
Management area of TradingMarkets’ Stocks Education section.
