Basing Xoma Comes Alive
Shares in Xoma are exhibiting the
bullish combination of price strength on heavy volume in the right side of a
correction-recovery pattern. But take care to sidestep a possible pullback in the near term.
The stock surged Monday 2 3/16 to 10
on seven times its usual trade. Bullish analyst remarks about the biotech
company’s experimental psoriasis drug served as the catalyst for the move. US
Bancorp Piper Jaffray analyst Mark Augustine raised his price target for Xoma to
$18 a share, citing the promise of anti-CD11a, a humanized monoclonal antibody that Xoma is developing with Genentech
(
DNA |
Quote |
Chart |
News |
PowerRating). Anti-CD11a selectively inhibits immune system T cells and is regarded as one of the most promising treatments for moderate-to-severe plaque psoriasis patients.

Monday’s advance enabled the stock to
clear its mid level of 9 9/16. The mid level
is the point where a stock which recently has corrected has made up half the maximum
point loss of the correction. The maximum point loss is the distance from a stock’s pre-correction
intraday high and the deepest low of the subsequent correction.
For long trades, I insist that
correction-recovery stocks have cleared their mid levels as well as their
50-day and 200-day moving averages. I presume stock below any of those three
levels could run into selling on attempted rallies because of overhead supply. Overhead supply is the amount of shares in
the hands of shareholders with paper losses. These weak
holders tend to sell into rallies. You can find a stock’s mid level by
summing the pre-correction high and the post-correction low, then dividing the
result by 2.
The stock has behaved positively over
the past two months while forming the second half of a correction-recovery
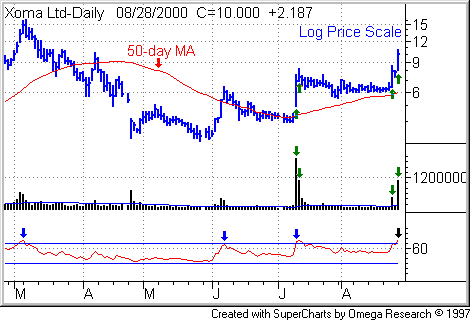
pattern. On July 11, Xoma shares gapped up and ran 64%, followed through the
following session, then consolidated the gains in a tightening range on low
volatility. Then Xoma broke out of that range recently, again on powerful
volume. In the above chart, I’ve indicated with green
arrows four big demand days coupling price advance with huge volume. This is clear evidence of heavy institutional
buying, much of it ahead of Augustine’s most recent remarks.
As an intermediate-term trader, I
would let this stock again digest its gains on light volume, or at least put in
a pullback. Look for entry or pivot points once the stock has gotten past the
danger of a sharp pullback on profit-taking.Â
Note that the stock has entered
overbought territory as defined as a reading of 70 or higher on the Relative Strength Index (see black
arrow). In the recent past, Xoma has pulled back and consolidated after hitting these RSI levels (see blue arrows).
There is no guarantee that the stock will pull back at this overbought level. Very powerful, sustained trends can send stocks into overbought or
oversold signals for extended periods of time. Trading is a game of playing
probabilities, not certainties. There are no certainties.
The key is to avoid buying into
extended stocks, putting yourself at increased risk of a pullback. Put the odds
in your favor by timing buys as stocks break out of trading ranges or above pivot
points after demonstrating support.
All stocks are risky and speculative.
On any new trade, be sure to reduce your risk by limiting your position size and
setting a protective price stop where you will sell your new buy or cover your
short in case the market turns against you.
