Bear Market, Bull Sector
You know you’re in a bear market when
the day’s only news mover forming a decent base is a grocery chain.
Whole Foods Market
(
WFMI |
Quote |
Chart |
News |
PowerRating)
Wednesday surged 3 7/16 to 54 7/8 on volume of 1.6 million shares, three times
the stock’s usual daily trade. After Tuesday’s close, the Austin Texas-based
natural foods retailer reported pro forma earnings of 48 cents a share for the Sept. 24
fiscal fourth quarter, up 20% from the prior-year quarter. The company also
announced plans to “aggressively pursue a sale” of its Amrion direct
marketing and manufacturing divisions.
Let me digress for a minute.
As an intermediate-term momentum
trader, I prefer to go long when high relative strength growth stocks are
completing sound bases in large numbers and the general market is trending higher on strong volume as measured on
the Nasdaq Composite or the S&P 500. Otherwise, I stay largely in
cash. For those of you who still look for limited long trades in
today’s adverse market, staying within the strongest groups becomes even more important than during bull markets.
Right now, that means defensive groups
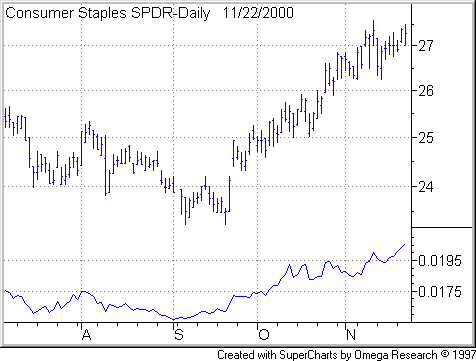
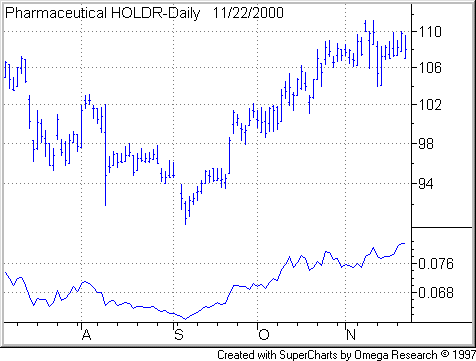
like consumer staples, utilities and healthcare. To help illustrate, check out
two exchange-traded
funds: the Pharmaceutical HOLDR
(
PPH |
Quote |
Chart |
News |
PowerRating) and the Consumer Staples
SPDR
(
XLP |
Quote |
Chart |
News |
PowerRating). In the following charts, I’ve shown each ETF’s daily price action
and its price performance relative to the S&P 500.
As you can see, each tradable fund’s
relative strength line has forged into new high ground. An upward sloping line
means the security has outperformed the S&P. A downward sloping line means
the security has underperformed the S&P.


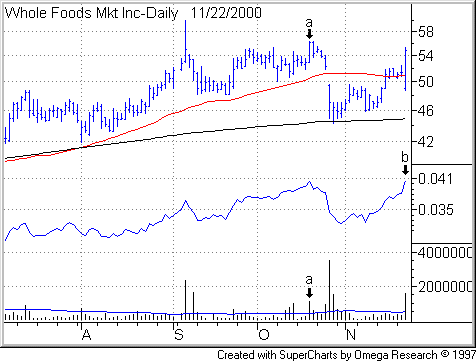
Now let’s look at a chart of Whole
Foods, which fits in the consumer staples sector. All charts in this
commentary use a logarithmic price scale. The Whole Foods chart also includes
50-day moving averages of price (in red) and of volume (in blue), a 200-day
moving average (in black) of price as well as a relative strength line (in
blue).

The stock Wednesday displayed a number
of bullish traits. It rallied sharply on powerful volume, obvious demand by
institutions. The session represented a bullish engulfing pattern: the day’s
high and low exceeded the prior day’s high and low, and the day’s close exceeded
the prior day’s high.
The stock rallied past its 50-day
moving price average and its mid level of 52 1/8. It previously cleared its
200-day moving price average. For long trades, I insist that stocks clear all
three of those levels in order to avoid excessive overhead supply. Overhead supply is the amount of shares in
the hands of shareholders with paper losses. These shareholders, called weak
holders, tend to sell into rallies. I think moving averages are self-explanatory
to TradingMarkets members. The mid level is simply the halfway point between a
stock’s pre-correction high and subsequent trough. You can find a stock’s mid level by
summing the pre-correction high and the post-correction low, then dividing the
result by 2.
Another point in favor of Whole Foods:
Its relative strength line moved into new high ground (see Point
B in the above chart). On momentum breakouts, if you use RS lines,
the RS line should precede price into new high ground or coincide with a price
advance into new high ground.
If I were trading this stock, I would
respect the overhead resistance 56 3/8, which the stock encountered on Oct. 19.
Note heavy volume on that session. The stock bit a lot buyers on that day. (See Points
A in the chart.) There are two ways to treat the 56 3/8 price level.
A trade could use it as a pivot point, or simply look for some later setup once
the stock has cleared it.
All stocks are risky. In
any new trade, reduce your risk by limiting your position size and setting a
protective price stop where you will sell your new buy or cover your short in
case the market turns against you. For an introduction to combining price stops
with position sizing, see my lesson,
Risky Business. For further treatment of these and related topics,
you’ll find extensive lessons in the Money
Management area of TradingMarkets’ Stocks Education section.
