Bottom Picking
Last week we looked at charts
of various large-cap stocks that appear to be in multi-year topping patterns.
Long-term charts give us perspective. We may not trade off of monthly charts, but we always want to be aware
of a market’s potential. This
week I want to start by showing you two more “big picture” charts, one
monthly and one weekly, of the S&P 500 index.
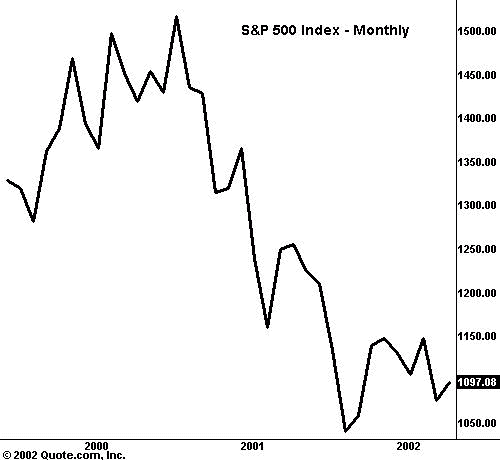
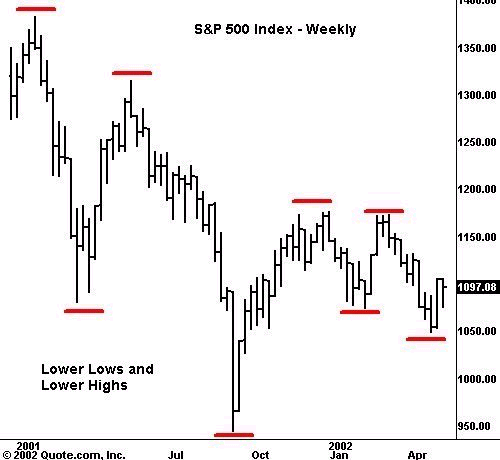
These charts are meant to
underscore and remind us that the vicious downward trend of the past two years
is still very much intact. The
consequences have been pervasive. Investors
have watched large chunks of retirement money vanish, while brokerage firms
have seen revenues shrink. Traders
have felt the pinch, too, as the bear trend along with other factors, such as
decimalization, have combined to suck out volatility from the stock market. Thus, it’s no surprise to see how captivated folks became following
last week’s rally — analyzing it, torturing it, and hoping to extract its
true meaning. The tired and
wounded desperately seek a whiff of bullish evidence!Â
When analyzing the early
stages of a new up or downtrend, I use the 10-day simple average as a short-term support and resistance level. On
both Tuesday and Wednesday of last week, the S&P and Nasdaq futures closed below
their 10-day averages, though not by much. Still, I would have preferred to see better price momentum and base
building before declaring a bottom. Overall,
the technical picture remains too murky for me to make a major statement.
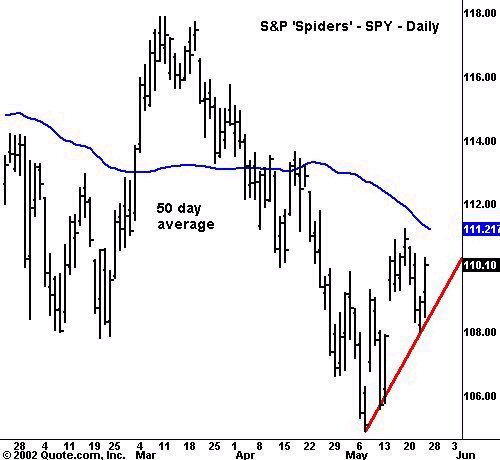
Should the market decide to
resume its primary downtrend next week, I’ll look to short the SPY on a
break of its short-term trend line (assuming it’s not already broken after I
submit this article Friday morning). The
May 7 lows in both the SP and Nasdaq futures are key support
levels to watch. If the market
fails to hold these levels, a retest of the lows from September of last year
seems inevitable.
On the other hand, if we hold
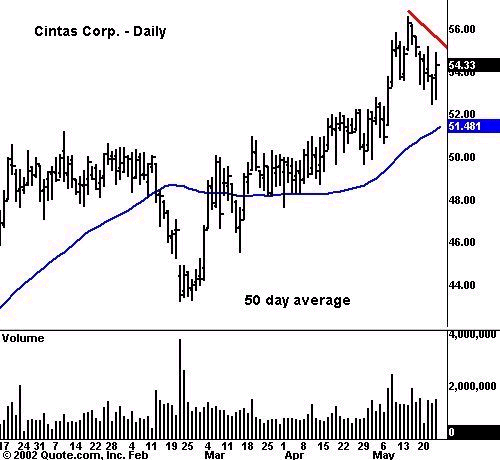
support next week and get enough pessimism to create a bottom, here’s a
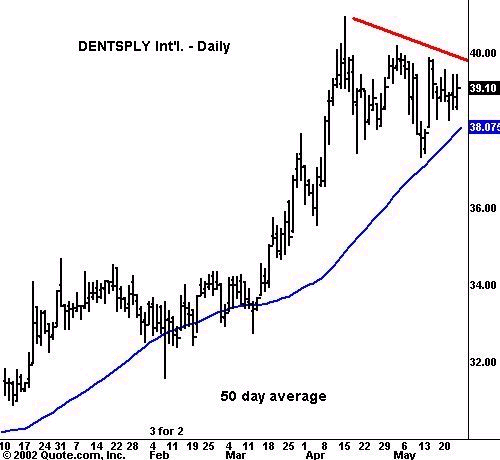
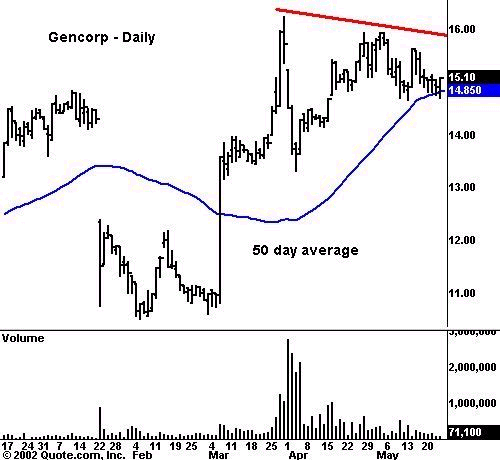
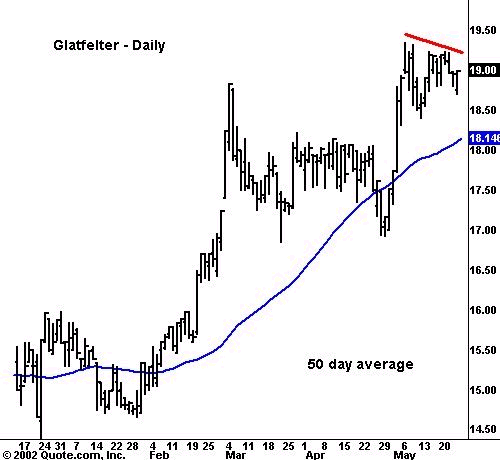
short list of stocks that could be interesting from the long side. Most of these are from the
S&P 400 Mid-Cap universe, are in established
uptrends, show good volume, and are trading above their 50-day average as I
write this article:Â
(
MOLX |
Quote |
Chart |
News |
PowerRating),
(
ERTS |
Quote |
Chart |
News |
PowerRating),
(
XRAY |
Quote |
Chart |
News |
PowerRating),
(
HDI |
Quote |
Chart |
News |
PowerRating),
(
CTAS |
Quote |
Chart |
News |
PowerRating),
(
QLGC |
Quote |
Chart |
News |
PowerRating),
(
GY |
Quote |
Chart |
News |
PowerRating),
(
CRS |
Quote |
Chart |
News |
PowerRating),
(
GLT |
Quote |
Chart |
News |
PowerRating),
(
JBHT |
Quote |
Chart |
News |
PowerRating),
(
MTX |
Quote |
Chart |
News |
PowerRating) and
(
HNI |
Quote |
Chart |
News |
PowerRating).
Have a good weekend.
Â
