Bulls Look To S&P, Dow
The Nasdaq closed below its July 24 low on Monday.Â
Much of the weakness in the Nasdaq
(
$COMPQ |
Quote |
Chart |
News |
PowerRating)
can be credited to weak Semiconductor
(
SMH |
Quote |
Chart |
News |
PowerRating) and Software
(
SWH |
Quote |
Chart |
News |
PowerRating) sectors,
both of which also closed below their July 24 lows. Meanwhile, the
S&P 500
(
$SPX |
Quote |
Chart |
News |
PowerRating) and
Dow Industrials
(
$DJX |
Quote |
Chart |
News |
PowerRating) continue to hang on to a portion of
their gains from last week.Â
The bulls, of which I am
one in the short term, are pinning their hopes on the idea that support will
be found imminently. In the S&P and Dow, the two support levels I am focusing
on are yesterday’s low (the August 5 low), and the low from the day after the
huge rally day, July 25. The July 25 low is particularly interesting to me
because the market recovered from a nasty intraday sell off on that day, and
then proceeded to rise for several days after. It has the feel of a support
level, especially if you were watching the intraday charts that day.
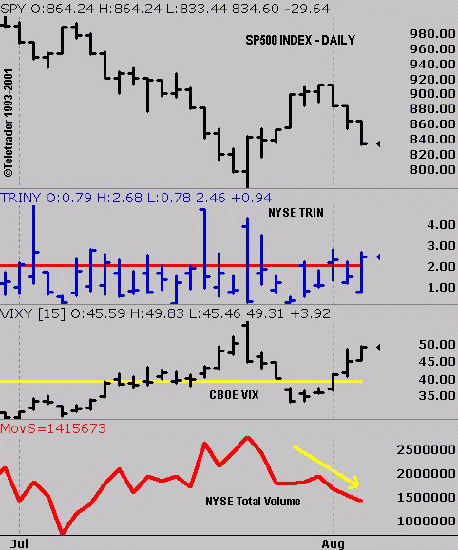
The CBOE VIX
(
$VIX |
Quote |
Chart |
News |
PowerRating) spiked to nearly
50 yesterday — a high level in any context — and a short-term positive for the
bulls. This is a nearly 45% jump from where VIX stood after the rally just one
week ago. VIX levels greater than 40 are generally indicative of intermediate
market bottoms. NYSE TRIN has also been hovering in oversold territory, with
two of the last three days closing over 2. And while NYSE breadth and up/down
volume ratios were quite negative Monday, total NYSE volume on this recent dip
has waned (i.e., bears not stepping on the gas) — see yellow arrow on chart
below.

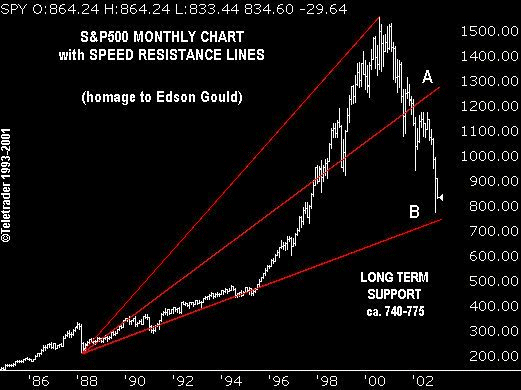
To get some
perspective on where long-term support in the S&P 500 index might be found, I
applied the speed resistance line (SRL) technique of Edson Gould to a monthly
chart of the index. For those unfamiliar with SRLs, the technique divides into
thirds a time-price range defined by two significant chart points. The angle
of the SRLs show 33.33% and 66.66% of the time-price range; support is often
found at either the 1/3 or 2/3 line. I anchored the starting point of the SRL
at the bottom of the 1987 crash, and anchored the top to the high in 2000.Â
The market appears to be holding right above the 2/3 support line, ca. 740.

Barring a
support-busting plunge in the S&P 500 and Dow Industrials, I’m looking for
defined risk long trades in the Biotech, Telecom and broad based sector ETFs
this week. See
my nightly service for full trade details.
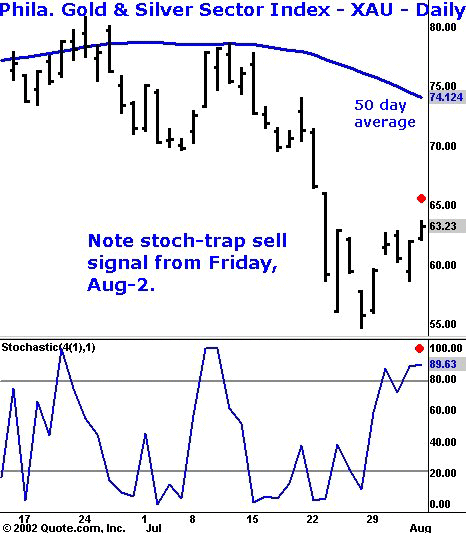
Before I finish, I want to highlight a stoch-trap sell setup in the
Philadelphia Gold & Silver Sector Index
(
$XAU |
Quote |
Chart |
News |
PowerRating)
that was triggered yesterday. On Friday, August 2, the XAU closed with stoch-trap
sell conditions — see daily chart detail below.Â

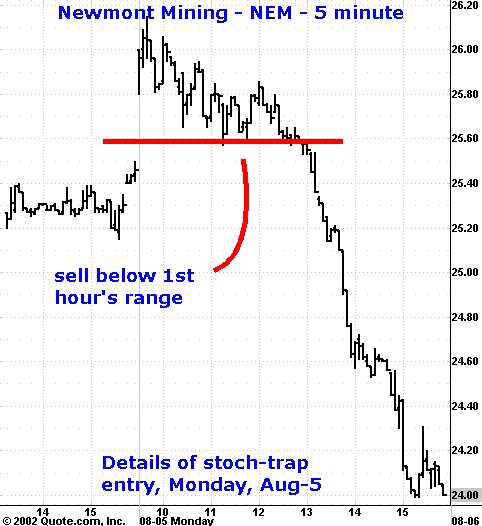
Thus, coming into Monday, August 5, the correct strategy was to sell on a
break below the first hour’s low — see 5-minute chart detail below.Â

Since there are no
ETFs for the Gold sector, I use market leader Newmont
Mining
(
NEM |
Quote |
Chart |
News |
PowerRating) as a proxy for actual trades. I wish they were
all this easy (they definitely are not).
Have a great day,
