Consider Position Sizing When Comparing Systems
Lots of
people like to compare systems on the basis of a single contract.
However, this can be very misleading. The following examples show you why.
One problem is with the lack of
position sizing rules. Often times, two equity curves will be compared and one
will show (for example) $1,000,000 in profits and a $30,000 drawdown, while the
other shows $1,000,000 in profits with a $50,000 drawdown. On the surface, the
first system looks better. However, this can be seriously flawed.
What if the second system had
position sizing rules that rejected certain single lot trades if the equity in
the account was under a certain amount? For example, “as long as the equity in
the account is less than 100k reject all trades with risk greater than $1500″.
This single rule could completely change the above numbers. Now the second
systems might show $800,000 in profits with only a $20,000 drawdown. Now all of
the sudden the same system both trading single contracts just flip flopped in
their ratios based on one money management rule!
In order to avoid this you need to
see results that show the system with all of the applicable position sizing
rules applied. Otherwise you may not be seeing the real system at all!
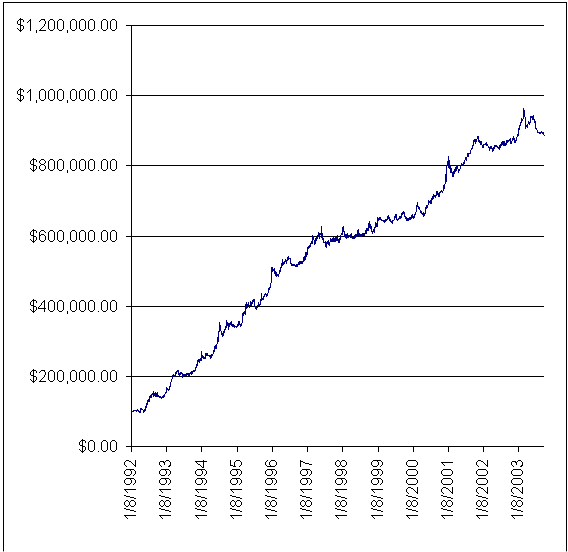
Example System Single Contract:
Net Profit: $788,103
Maximum Drawdown: $77,234
Ratio: 10.20
This example shows a 50k account. To
somebody that did not understand position sizing vs. single contracts they may
look at this and think “oh my god, a $77,234 drawdown on a 50k account, no
way!”. However, what they may not realize is that when the account was less than
100k it was supposed to skip trades with risk above $1500. This rule would
change the results, see below.

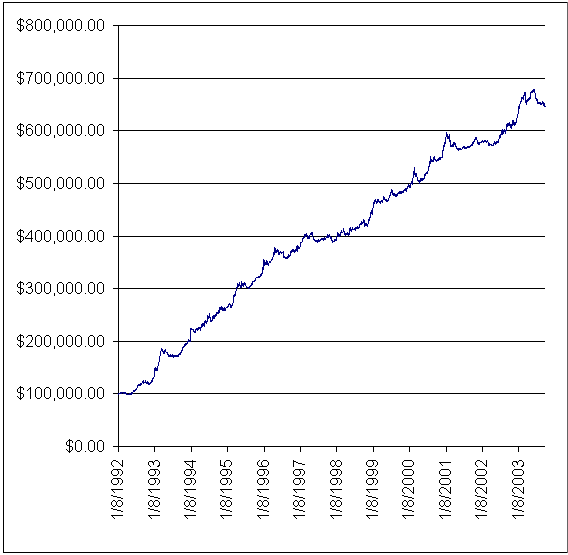
Example System Reject Trades with
Risk Above $1500
Net Profit: $547,170
Maximum Drawdown: $33,302
Ratio: 16.4

Here you can already see a big
change. Just this simple rule cut the drawdown by more than half and
increased the ratio. This is why systems designed with good money management and
position sizing rules should never be compared on a single contract basis.
Without the position sizing rules factored in its not the real system!
Although, the above example is also
flawed because it skipped all trades that were above $1500 in risk
no matter how high the equity got. However, it was supposed to stop skipping
those trades once the equity got to $100k. Therefore, you need to rerun the test
inside a real position sizing based system tester.
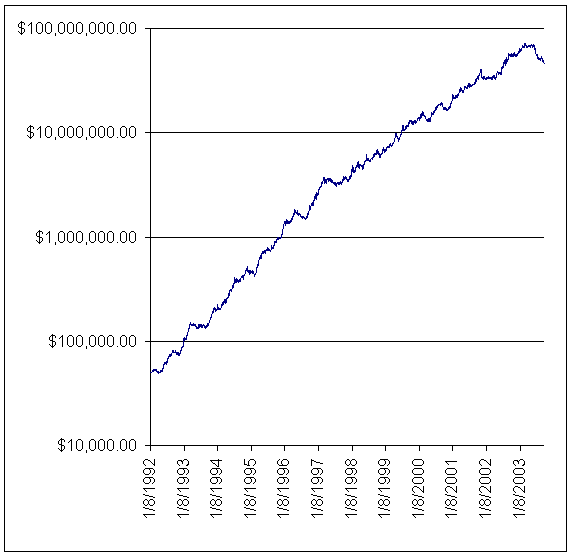
Example System with Proper
Position sizing applied.
Average Annual Return: 79.2%
Maximum Drawdown: 36.08%
There was no way from the above
single contract examples to know what the final outcome was going to be with all
of the position sizing applied. Therefore, you MUST see results in a way where
all of the money management and position sizing rules have been applied. Some
vendors who don’t understand this will attempt to compare single contract
reports with a system designed with money management. The problem is that the
single contract report may not really be the system at all. This is why we give
you some comparison reports in what we feel is the proper format (see
here).

Until next time,
DHoffman@TradersTech.Net
Risk Disclosures
COMMODITY TRADING involves high
risks and you can lose a significant amount of money. Commodity trading is not
suitable for many investors. Any performance results listed in all marketing
materials represents simulated computer results over past historical data, and
not the results of an actual account. All opinions expressed anywhere on this
website are only opinions of the author. The information contained here was
gathered from sources deemed reliable, however, no claim is made as to its
accuracy or content. Different testing platforms can produce slightly different
results. Our systems are only recommended for well capitalized and
experienced futures traders.
CFTC REQUIRED RISK DISCLOSURE
HYPOTHETICAL PERFORMANCE RESULTS
HAVE MANY INHERENT LIMITATIONS, SOME OF WHICH ARE DESCRIBED BELOW. NO
REPRESENTATION IS BEING MADE THAT ANY ACCOUNT WILL OR IS LIKELY TO ACHIEVE
PROFITS OR LOSSES SIMILAR TO THOSE SHOWN. IN FACT, THERE ARE FREQUENTLY SHARP
DIFFERENCES BETWEEN HYPOTHETICAL PERFORMANCE RESULTS AND THE ACTUAL RESULTS
SUBSEQUENTLY ACHIEVED BY ANY PARTICULAR TRADING PROGRAM.
ONE OF THE LIMITATIONS OF
HYPOTHETICAL PERFORMANCE RESULTS IS THAT THEY ARE GENERALLY PREPARED WITH THE
BENEFIT OF HINDSIGHT. IN ADDITION, HYPOTHETICAL TRADING DOES NOT INVOLVE
FINANCIAL RISK, AND NO HYPOTHETICAL TRADING RECORD CAN COMPLETELY ACCOUNT FOR
THE IMPACT OF FINANCIAL RISK IN ACTUAL TRADING. FOR EXAMPLE, THE ABILITY TO
WITHSTAND LOSSES OR TO ADHERE TO A PARTICULAR TRADING PROGRAM IN SPITE OF
TRADING LOSSES ARE MATERIAL POINTS WHICH CAN ALSO ADVERSELY AFFECT ACTUAL
TRADING RESULTS. THERE ARE NUMEROUS OTHER FACTORS RELATED TO THE MARKETS IN
GENERAL OR TO THE IMPLEMENTATION OF ANY SPECIFIC TRADING PROGRAM WHICH CANNOT BE
FULLY ACCOUNTED FOR IN THE PREPARATION OF HYPOTHETICAL PERFORMANCE RESULTS AND
ALL OF WHICH CAN ADVERSELY AFFECT ACTUAL TRADING RESULTS.
