Focus On ETF Action
Welcome to my new column.
The impetus behind this column is the tremendous growth in
Exchange Traded Funds (ETFs). By now
most of us know the story behind these instruments: ETFs trade like stocks,
are bought and sold on regulated exchanges, are not subject to uptick rules,
can be sold short, can be bought on margin, and represent a basket of stocks,
thereby offering the safety of diversification.
For those who want to learn more about ETFs, some excellent
reference
articles are available on the TradingMarkets website.
I’ve also included a short list of my favorite external links at the
end of this article.
Just how popular are ETFs?
Washington,
DC, May 30, 2002 – The combined assets
of the nation’s exchange-traded funds (ETFs) were $85.86 billion in April
2002, according to the Investment Company Institute, the national association
of the investment company industry.
By comparison, total ETF
assets in June of 2000 were less than $50 billion. I’ve read some estimates that predict assets will grow to over
$500 billion by 2007. ETF
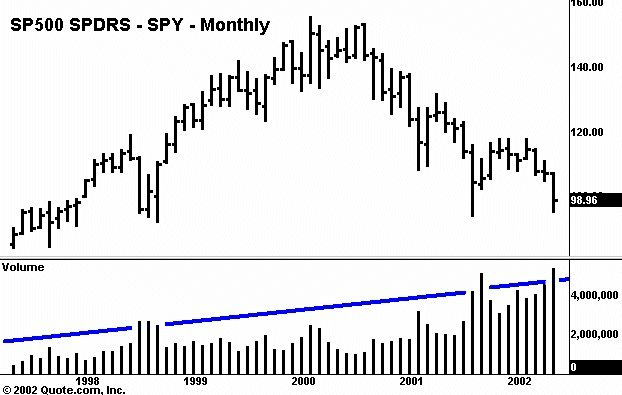
volume (as depicted in this monthly chart of the popular SPY) is on steady
uptrend.

Seems like a classic bull
market in ETF asset growth and trading volume, to me. I will be focusing on the
action in the broad indexes and the industry sectors, using ETFs as the
instrument of choice for both analysis and trading ideas. I will not be covering each and every sector or ETF instrument, but
rather only those with sufficient daily volume and volatility for active
trading. Occasionally I will
discuss some of the major underlying component stocks, rather than the ETFs.
In sectors where no ETF currently exists, a cash index will be used
instead.
Market
Commentary
The broad indexes took out
important support levels last week, leaving the September 2001 lows vulnerable
to attack. Sentiment as measured
by Investors Intelligence remains high — certainly higher than we’ve seen
at other major market lows. Virtually
all the sectors I follow, save perhaps Gold
[$XAU.X|$XAU.X) and Healthcare
(
$HMO.X |
Quote |
Chart |
News |
PowerRating), are in
downtrends, trading below their respective 50-day moving averages, and lacking
any clear signs of reversal.
On a
short-term basis, however, measures of sentiment such as the
VIX and
upside/downside volume ratios suggest minor oversold conditions. Trading for a bounce here is only for the very nimble – and very
courageous – in my opinion. Personally,
I’m looking for a couple more days of capitulation type volume followed by a
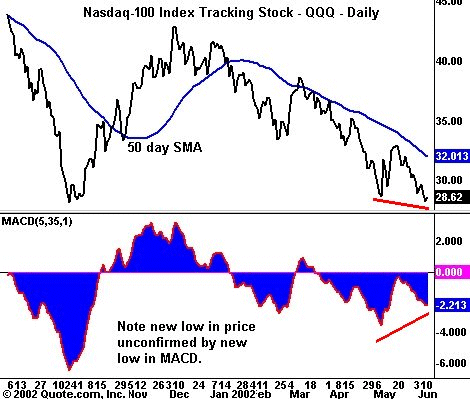
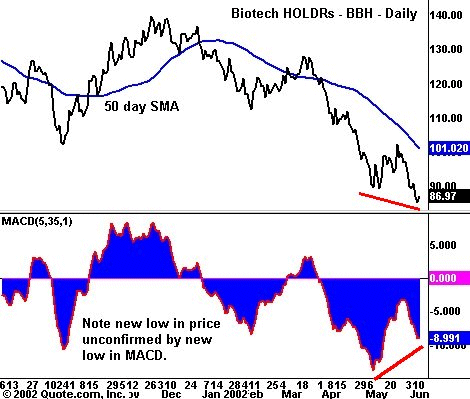
surge in positive breadth and momentum before making any long calls. But if you are bottom fishing, check out these momentum divergences on
the daily charts.


The indicator here is the
5/35 MACD. Very simply, when
momentum fails to confirm price action, you have a divergence.
Momentum divergences often precede reversals in price. These are by no means guaranteed signals, but they are conditions to be
aware of, should the market begin to find upside traction. Sectors with divergences currently include the
Biotech HOLDRs
(
BBH |
Quote |
Chart |
News |
PowerRating), Nasdaq
100
(
QQQ |
Quote |
Chart |
News |
PowerRating), Software HOLDRs
(
SWH |
Quote |
Chart |
News |
PowerRating), and Securities Broker Dealer Index
(
XBD |
Quote |
Chart |
News |
PowerRating).
My Favorite ETF Links
https://www.ici.org/aboutfunds/etf_faqs.htm
