Focus On Price Action
I
want to thank Larry and his staff at TradingMarkets.com for the
opportunity to speak directly to you. The
quality and breadth of information available within these pages
is remarkable, and it’s an honor to be associated with a group of such
outstanding traders.
Because
I will be at the 27th annual MTA seminar in Jupiter Beach for the
next several days, I will not have the benefit of seeing Thursday or Friday’s
market action. So if they catch Bin Laden between now and the closing bell
Friday, please ignore everything I’m about to say.  Â
Have
we or have we not hammered out a meaningful bottom in the stock market over the
past week-and-a-half? Although price
momentum was impressive early in the week, with the Dow jumping over 350 points
in two days, we still did not see the kinds of overwhelming
breadth or volume statistics that would lead us to conclude this move is
anything more than a rally in a bear market. Investors
Intelligence Sentiment data also remains at the high end of the net bullish
range, which is not a feature of other bottoms we’ve seen in the past.Â
Frankly I am bearish
on the long-term outlook for the stock market. In
deciding upon a name for this column, I seriously considered such titles as
“Run For Your Life” and “Dow Ground Zero.”
Why am I bearish longer term? Take
a close look at the weekly and monthly charts of key large-cap stocks such as Home
Depot
(
HD |
Quote |
Chart |
News |
PowerRating), General Electric
(
GE |
Quote |
Chart |
News |
PowerRating),
Microsoft
(
MSFT |
Quote |
Chart |
News |
PowerRating), IBM
(
IBM |
Quote |
Chart |
News |
PowerRating), Pfizer
(
PFE |
Quote |
Chart |
News |
PowerRating), Abbott
(
ABT |
Quote |
Chart |
News |
PowerRating), Citigroup
(
C |
Quote |
Chart |
News |
PowerRating), and American
International Group
(
AIG |
Quote |
Chart |
News |
PowerRating).
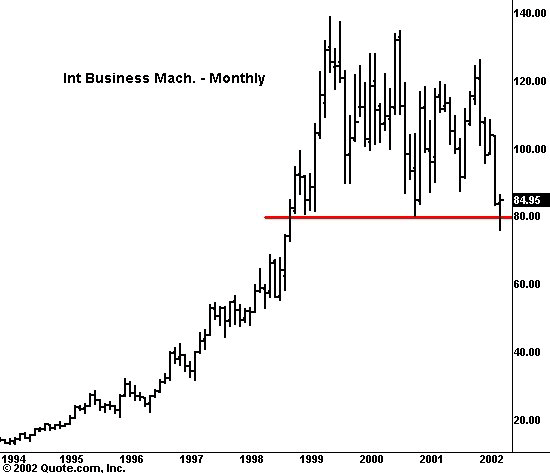
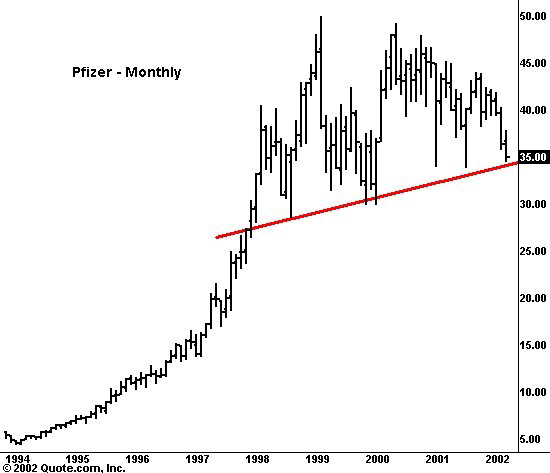
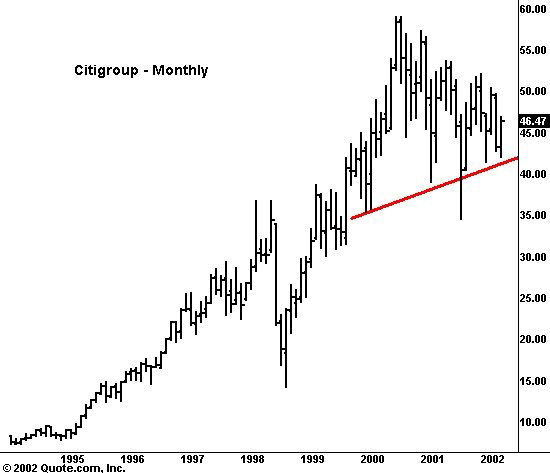
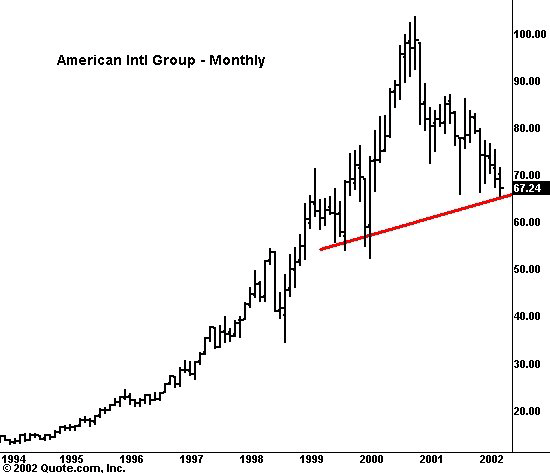
Do you see bottoms?Â
I think I would
believe the cute little boy who whispers to Bruce Willis “I see dead people,â€
before I would believe “I see bottoms,†in these names.
Yes, the 3Ms
(
MMM |
Quote |
Chart |
News |
PowerRating) and the Johnson
& Johnsons
(
JNJ |
Quote |
Chart |
News |
PowerRating) of the
world continue to scratch out new highs.  Â
Don’t let all my
negative talk sway you however. I
am still a trader and not a long-term market forecaster.
My goal is to find inflection points in the data and trade the shorter-term
“swings” which may often be in direct conflict with my long-term
views.Back to the market.
Price momentum is really the only thing the bulls have had to hang their
hats on this week. For the coming week,
the focus should be squarely on whether price momentum sustains itself or
improves on the action we saw earlier this week.S&P and Nasdaq
futures (see charts).Â
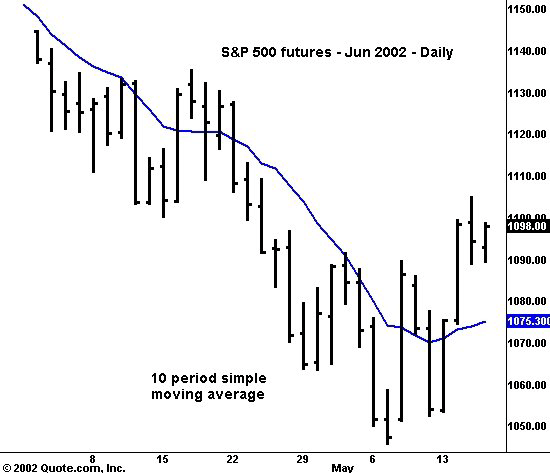
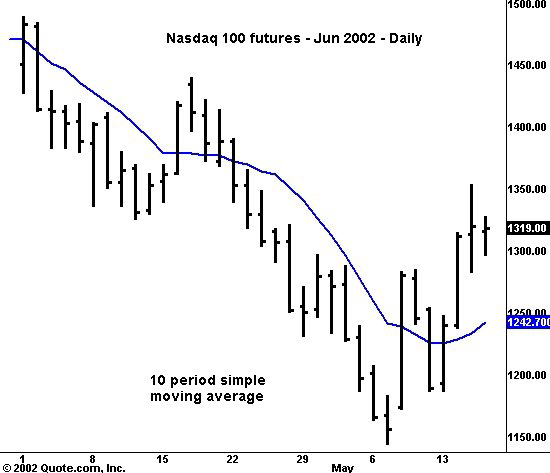
On a pullback I will
look for prices to be contained by, and close above, these levels.
Conversely on a close below the 10-day average, I will largely abandon
any hope for bottom. If the market
manages to hold together, the names I want to look at from the long side will be
from the S&P Midcap 400 universe and/or
the Mid Cap SPDRs
(
MDY |
Quote |
Chart |
News |
PowerRating). Â
A quick word about
the commodity markets. Most of these
markets are trading at historically low levels — in some cases 20 and 30-year
lows — in markets such as coffee
(
KCN2 |
Quote |
Chart |
News |
PowerRating), cotton
(
CTN2 |
Quote |
Chart |
News |
PowerRating), orange
juice
(
JON2 |
Quote |
Chart |
News |
PowerRating), corn
(
CN2 |
Quote |
Chart |
News |
PowerRating) and wheat
(
WN2 |
Quote |
Chart |
News |
PowerRating).
Yes prices can go lower from here. But
the major risk is not to the downside at this point.
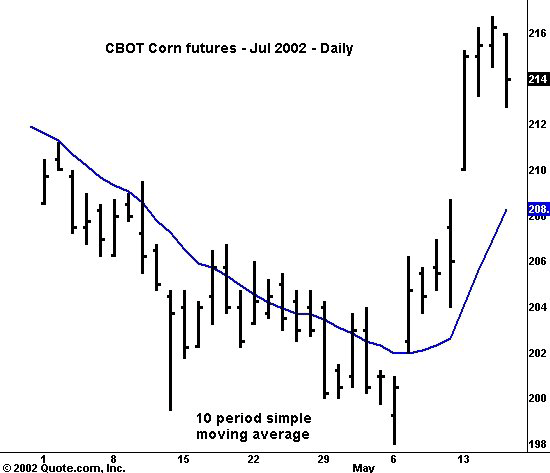
The corn market has just had a good rally and I wouldn’t be surprised
if it was the start of something larger. Look
for the July corn contract to find support around the gap from last week, in the
208 area. If corn can hold that
level, it may represent a low risk re-entry point from the long side.
Â
In the coming weeks
I will be going into more detail on how I select individual names and how I
derive specific entry and exit levels based on chart patterns and indicator
setups. Have a great weekend.
