Friday’s Levels
Thursday Recap: In our
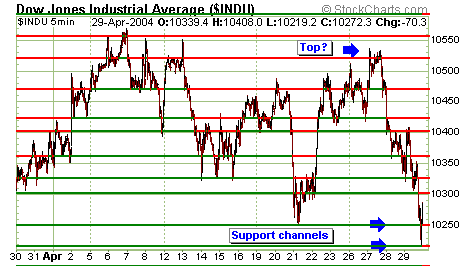
prediction for Thursday, we noted that if the cash Dow could get above 10330 we
might challenge what was strong sell pressure near moving average and chart
resistance at 10400. Further, we noted that if we broke 10330 on the downside,
we might visit 10300 and ultimately 10330. That’s pretty much what happened
Thursday. The Dow started the day successfully testing support at 10330, then
bounced. This looked like a strong bounce and a potential bottom. However,
when the Dow reached 10400, sellers took control, moving the Dow lower past
10330, 10300 and 10250 before buyers got courage near 10220, pushing the Dow
higher at the close to finish at 10272.

                        Â
Charts from
www.stockcharts.com
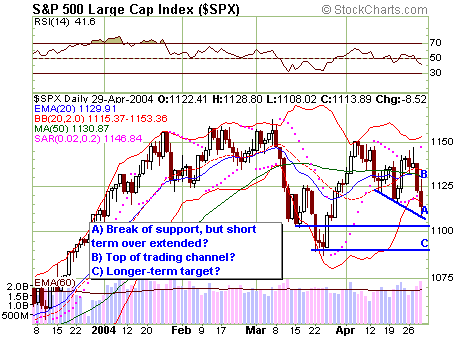
On a percentage basis, the cash S+P was negative
in a similar fashion to the Dow. The S+P took out minor SAR support and blew
past its lower Bollinger band.

However, the worst performer of the day was the
NASDAQ (surprise?). The tech-laden index was down close to 1.55%, double that
of the Dow and S+P.Â

^next^
Prediction for Friday:Â We could
get an oversold bounce on Friday, but it will be interesting to see how far this
bounce takes the index and if it holds.Â
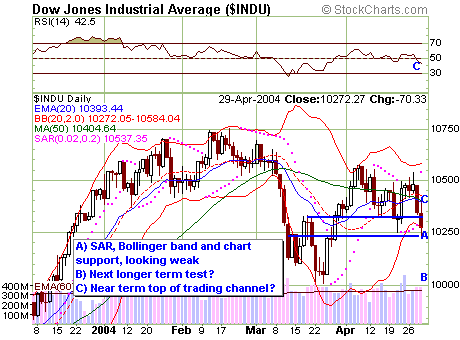
I think ultimately we may have defined a new
trading channel, with the moving averages operating as an upside top and the
downside still to be defined.
On the NASDAQ, I ultimately expect a test of the
200-day moving average, which could define the lower end of the trading range.Â
If the 200-day breaks and holds, the entire market will likely move to the
downside and potentially explore new downside support.Â

On the Dow, the 10400 level and moving average
resistance is likely to define a new trading channel on the top. This might be
a good point to get negative. On the downside, we might ultimately test the
10,000 level. The S+P is similar to that of the Dow, with upside resistance
near the moving averages and longer-term downside targets the recent lows.
Portfolio Strategy:Â Right now
we are delta negative. We could adjust the structure of the portfolio by
rotating out of the mini-Dow future with a VIX future.    Â
Yesterday’s Results and Current Portfolio Status:
Daily Loss: $205
Â
9900 May Mini Dow Put Options: We are long 2 put options. Yesterday we bought
two additional options at 31 and sold 4 options at 24. Loss yesterday with this
position was 130. We are flat the 9900 puts.Â
Â
10100 May Mini Dow Put Options: We are short 2 put options. Yesterday this
option settled at 80, up 20. Loss yesterday with this position was $200.Â
Â
10100 June Mini Dow Put Option: We are short 2 put options. Yesterday it closed
at 160, up 25. Loss yesterday with this position was $250.
Â
10600 May Mini Dow Call Options: We are short 2 put options. Yesterday this
option settled at 22, down 13. Profit yesterday with this position was $130.Â
Â
10600 June Mini Dow Call Option: We are short two call options. We sold an
additional call 4/28/04 at 91. Yesterday it closed at 72, down 25. Profit
yesterday with this position was $250.
Â
Mini Dow Futures: We came into the day flat the mini Dow future. We sold one
mini Dow future at 10270. Yesterday it settled at 10271. Loss on this position
was $5. We are now long one mini Dow. Â
 Â
Trading Method:Â Mark Melin strategically short sells options and then
directionally trades within this short options portfolio, always hedging one
position against another to generate consistent profits.
If you have other questions or suggestions, please send an e-mail to
subscriptions@dowoptionstrader.com
Trading Method:Â Mark Melin strategically short sells options and then
directionally trades within this short options portfolio, always hedging one
position against another to generate consistent profits
Â
DISCLAIMER:
Past performance is not necessarily indicative of future results.
There is a substantial risk of loss in commodity futures and options
trading. It is not suitable for all investors. Only you can determine
whether this trading suits your particular needs and risk tolerance.
All profit and loss representations are hypothetical and based on the real
time signals generated by The Dow Trader. The results have not been
adjusted to reflect slippage or commission charges. No representation is
being made that any account will or is likely to achieve profits or losses
similar to those shown.
