Friday’s Levels
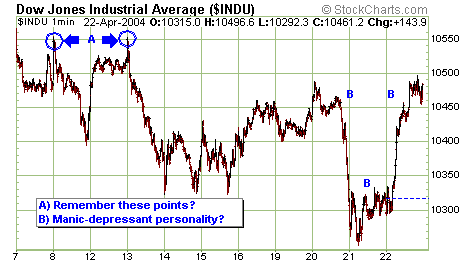
Thursday Recap: Yesterday I kept
an eye on the 10330 level on the cash Dow. In our prediction it was noted that
if this level broke it would change the bearish view on this market. As well, I
noted that if various resistance was broken we could see a test of the Dow’s
50-day moving average.  In fact on Thursday the cash Dow started out trading in
the 10300-10330 zone. Then the cash Dow broke 10330 and it was off to the races
(at this time our buy stop order executed at 10342 on the mini-sized Dow
futures). The Dow then quickly moved up as fast as it moved down two days ago,
essentially ending near where we started.  Â
Â
                              Â
Charts from www.stockcharts.com
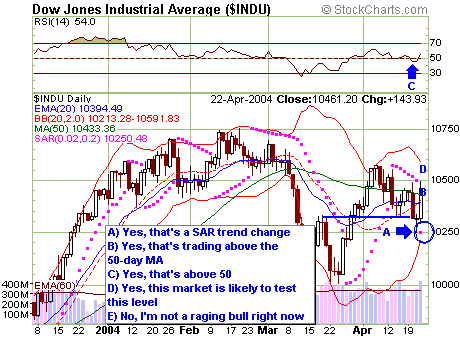
On the day the Dow was up some 143 points on big
NYSE volume of 1.9 billion.
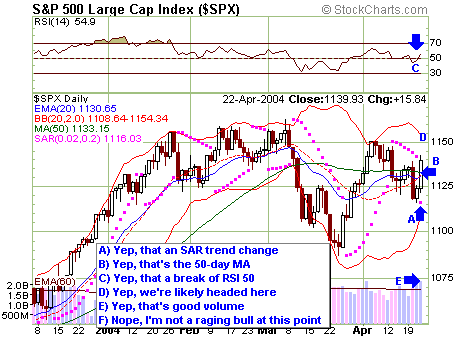
Like the Dow, the S+P was up close to 16 points.
 Â
Â
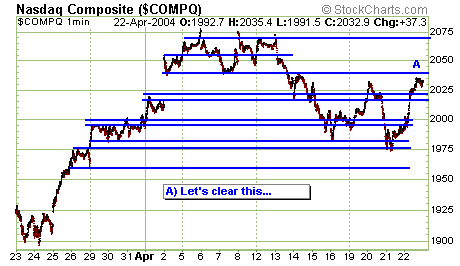
On the day the NASDAQ was once again leading this
market higher, up 1.87% on the day, while the Dow and S+P were respectively up
close to 1.4%. The fact the NAS is once again asserting leadership is a good
sign for market bulls.
Â
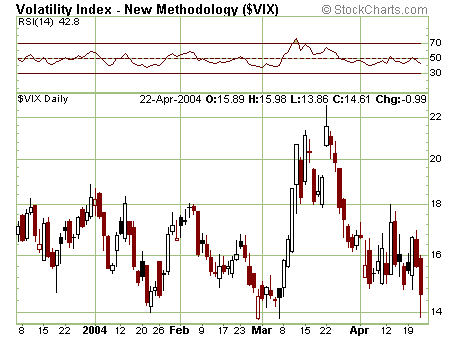
Interestingly, with the Dow up 145 points and the
S+P up 15.8, volatility dropped significantly, with the VIX index down to touch
recent yearly lows at 13.86 before ending at 14.61. Historically that is some
low volatility — almost an unnatural low.
Prediction for Friday: We’re
likely to head higher on Friday. Ultimately I’m looking for a challenge of the
recent highs near 10550 on the cash Dow. We haven’t been getting much
follow-through lately, so let’s see if we get follow-through today — trading a
market without follow-through is a little difficult.
While a lot of the market indicators looked good,
and we’re likely to touch 10550 on the cash Dow, I’m not a raging bull
at this point. I really think we’re in a trading range bouncing around between
10,000 and 10750. Right now we are near the value distribution region in the
range. I expect us to move out of that range and test 10550. If that breaks I
might get a little more excited about this market, playing a positive bias until
we get a little closer to 10700 — that’s if we break 10550, which might not
happen. You’ll recall that previously when we hit the 10550 level on the cash
Dow that provided a sell signal.
Portfolio Strategy: Right now we are close to neutral with a
slight negative bias. We’re likely to change that to a positive bias early in
the session once we see how the market sets up.Â
Trading Results from Previous Day and Current Portfolio Status:
Daily Loss: $75
Â
9900 May Mini Dow Put Options: We are long 2 put
options. Yesterday this option settled at 30, down 17. Loss yesterday on this
position was $170.Â
Â
10100 May Mini Dow Put Options: On 4/19/04 we
sold 2 Mini Dow Put Options, one at 70 and the other at 66. Yesterday this
option settled at 50, down 35. Profit yesterday with this position was $350.Â
Â
10100 June Mini Dow Put Option: On 4/22/04 we
sold 1 Mini Dow Put Option at 103. Yesterday it closed at 120. Loss yesterday
with this position was $85
Â
10600 May Mini Dow Call Options: On 4/19/04 we
sold 2 Mini Dow Call Options at 66. Yesterday this option settled at 60, up
25. Loss yesterday with this position was $250.Â
Â
10600 June Mini Dow Call Option: On 4/21/04 we
sold 1 Mini Dow Call Option at 97. Yesterday it closed at 137, up 34. Loss
yesterday with this position was $170
Â
Mini Dow Futures: We came into the day flat the
mini Dow future. We bought one June mini-Dow at 10342 and sold that same
mini-Dow at 10392. Profit on the day with this position was $250. We are now
flat the mini Dow.Â
Â
Â
Trading Method:Â Mark Melin strategically
short sells options and then directionally trades within this short options
portfolio, always hedging one position against another to generate consistent
profits
Â
Â
Â
