Here’s How I Identify The Stocks I Trade
Hi,
my name is Costas Tsaklas. I’m a full-time trader and a long-time
member of Tradingmarkets.com. Over the years that I have been part of this
community, many traders have asked me about the process I follow to identify
stocks that I trade. In this article, I will describe this process step-by-step
and I will provide a brief description of how I enter most of my trades. I say
“most of my trades†because there are always exceptions.
Â
I am a firm believer that
during the trading day, the only thing a trader should do is execute their
trading plan. The trading plan, which includes the stocks, their entries, stops
and targets, is something that must be done either the night before or over the
weekend, as I personally prefer. I consider myself a swing trader. In most
cases, my trades last from one to two days and I’m looking to make one to two
points, on average. Although I use initial protective stops, I don’t use
trailing stops. I expect the stocks I trade to move to my profit targets in a
short period of time. If they don’t, I close the position, with or without a
profit.
Â
As I mentioned before, the majority of my analysis takes place
over the weekend. I scan through hundreds of charts on the weekly timeframe,
looking for stocks that recently changed their trend from down to up and visa
versa. When I find these stocks, I keep them on a watch list, waiting for them
to provide low risk entries that have a clear and definable stop. Let’s look at
ATRS, a stock I recently traded:
Â

Â
First, I want to identify the intermediate-term trend of the
stock. Looking at the chart, is not always clear where exactly the uptrend ended
and when the downtrend began. Since I am a big fan of Gann’s method of trading,
I use Gann Swings to define the trend. A series of two consecutive higher highs
on the weekly timeframe establishes the last low as “swing pivot low†and two
consecutive lower lows, establish the last high as “swing pivot high. Take a
look at the second chart:

Â
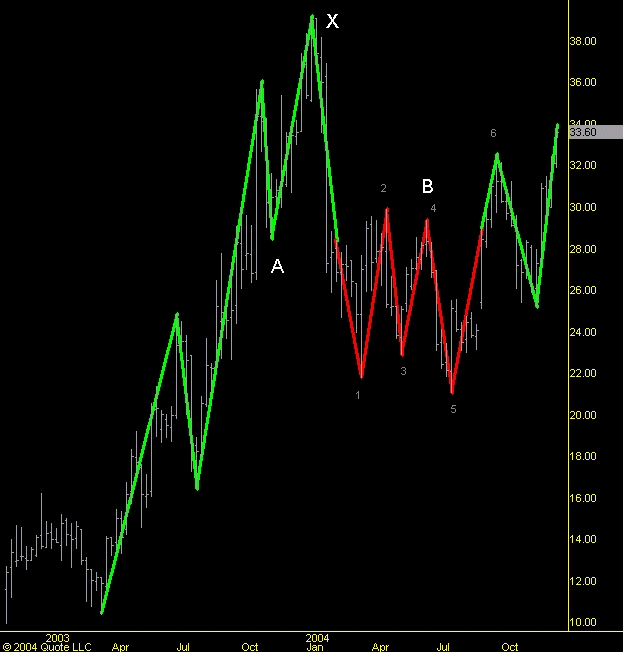
Throughout 2003, ATRS was on an intermediate term uptrend as it was defined by
higher highs and higher lows. Point A was the last swing pivot low before the
yearly high at point X. After that, the stock started to correct and when the
price moved below the pivot at point A, the trend changed from “up†to “downâ€.Â
Although there were rallies during the downtrend (from point 1 to point 2 and
from point 3 to point 4) the stock was on an intermediate term down swing and if
anyone wanted to trade from the long side during these rallies, the trades
should have been considered “counter-trendâ€. After a low in July 2004 (point
5), the stock started another counter-trend rally up to the point it traded
above point B (previous swing pivot high). At that moment the intermediate term
trend changed again to “up†and from that point forward I started looking for a
pullback to setup a long entry. For trade set-ups I use the daily chart.Â
Although the timeframe is different, the process remains the same.
Â

Â
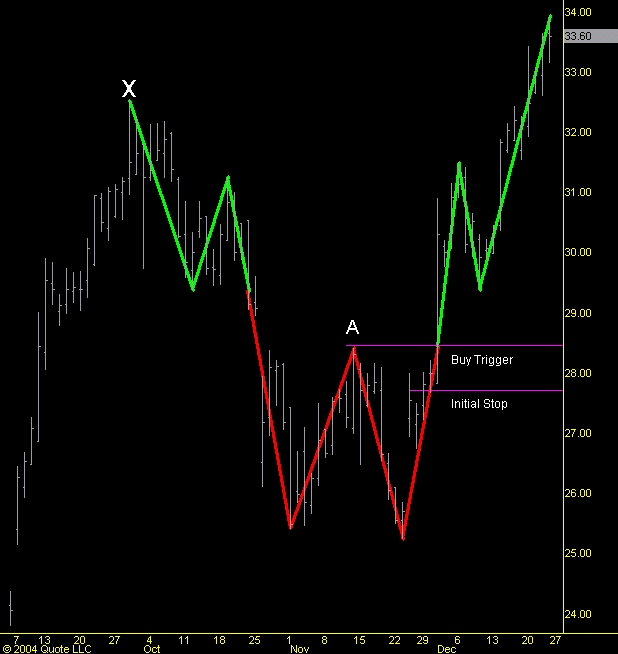
As
ATRS started correcting from late September 2004 (point X) I started looking for
the moment that the stock will trade above the previous, short-term, pivot high,
in order to initiate a long trade.Â
Â
In
order to be ready to enter a trade when all the criteria are in place, I set my
software to alert me when the price reaches either a pivot high or low. This
way I don’t have to constantly monitor all the stocks that are setting up on a
daily basis. Every weekend I update the alerts with new values if new swing
pivots have been established.
Â
Late November 2004, ATRS triggered a buy entry as it traded above the previous
pivot high at point A. I initiated a long trade and I placed my stop below the
low of the previous day. From that point on, the chart of the stock was in
front of me, on my daily watch list and I traded it from the long side for as
long as the trend remained up.
Â
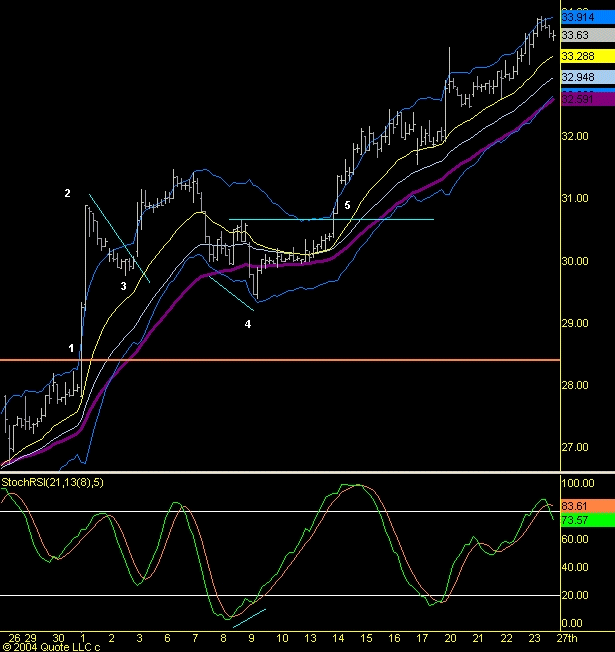
For managing a trade, I use a 60-minute chart with three
exponential moving averages (50-period, 34-period and a 20-period) in addition
to Keltner channels. Since the weekly and the daily trends are up, as defined
by the Gann Swings, my expectation is that the moving averages will maintain a
positive crossover for as long as the daily trend remains in the same
direction. Within this trend, I look for trades based on traditional technical
analysis patterns
Â
Â
 Â
Â
Â
Let’s take a look how many trades were setup since then:
Â
First trade was the breakout
above the daily pivot high at point 1. The stock moved fast, over two points,
and closed at the extreme of the second hourly bar outside the Keltner band
(point 2). This is usually a sign that the stock is ready to consolidate.
Â
Another trade was the bull
flag, at point 3, just above the 20-period EMA.Â
Â
At point 4, we see a positive
divergence, along with a test of the 50-period EMA on the 60-minute timeframe.
The stock bounced off the lows and slowly moved up towards the previous pivot
high. At point 5, the stock traded above that pivot high and triggered another
long entry. The question someone might ask is why don’t I hold the stock for as
long as it is moving up, instead of getting in and out. That is something which
has to do with my personality. I feel more comfortable taking a one-point of
profit when I have it instead of waiting to see how much I could “potentiallyâ€
make on the trade. In my opinion, there isn’t a right or wrong way to approach
this issue. Traders have to identify what works best for them and stick with it.
Â
Trading is a business of
managing risk and uncertainty. In order to be successful, we need to be able to
reduce the risk by identifying the direction of the trend. The use of Gann
Swings is not the only method for this purpose, but it is the method I feel most
comfortable with and that’s very important. Find a method you understand and
stick with it. I know it sounds easier than it actually is, but having a set of
rules to follow will improve your trading results dramatically. Having a wrong
plan is better than having no plan at all.Â
Good luck with your trading!
Â
Costas Tsaklas
Â
Costas Tsaklas is a full-time
trader of stocks and futures. Although he is involved in the stock market from
the early 90’s, Costas made trading his full-time profession, in 1997 . Prior
to that he owned and operated a succesful software consulting business for the
financial industry. Costas believes that proper management of risk is the key to
succesful trading.”
