Here’s Why Fund Flow Data Can Be Helpful
For the week ended October 1, AMG data is reporting that equity funds–including
those that invest abroad–posted net cash outflows of $2.15 billion, with
technology funds witnessing the largest redemptions. This week’s net outflows
were the largest since March 12, underscoring the contrarian nature of the
average retail investor.
Taxable bond funds reported outflows totaling $.66 million for the week
ended Oct 1. Aggregate inflows for this year however, total $77.8 billion,
which is dramatically more than the amounts reported during the same period in
1998 (+$44b), 1999 (+$20b) and 2000 (-$60b).
A sustained trend in outflows from bond funds into stock funds would signal
capitulation by the remaining bearish investors, which, in my view, would then
suggest that caution should be exercised by equity bulls. Until that time
however, there is still plenty of retail money on the sidelines to buy stocks.
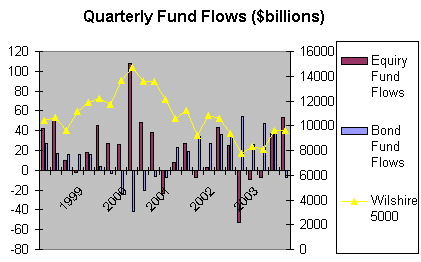
The chart below illustrates periods of extreme shifts in mutual fund flows
relative to the Wilshire 5000 and has been a good contrarian market
indicator during periods of extreme inflows–outflows, such as in 2000 and last October.
‘
Although I have been laying down the case for job growth in the months ahead,
I was not expecting the move to happen in today’s payroll data for September,
which showed an increase of 57,000 jobs. In hindsight, yesterday’s convincing
sell-off in Treasuries and a steepening in the yield curve should have set off
alarm bells for equity investors that today’s data was going to be bullish.
Another interesting development in the markets over the past two days has been
the inability of gold to hold onto its recent gains while bond yields,
equities and the industrial metals have moved higher. Gold should be moving
higher as the reflation scenario gains credence. This suggests that the
precious metal is overbought and may be see more of a pull back.
