How To Use TradingMarkets.com’s ‘Stock Building A Base’ Screen
As an
intermediate-term trader, I’m mainly interested in three criteria
when I hunt for buy candidates, one fundamental and two technical.
Fundamentally, I’m interested in
buying stocks of companies expected to show at least 30% earnings growth, and
preferably 40% or more, during the next one to two fiscal years.
Technically, it’s important for me to
know that the market believes in a stock more than it believes in the average
issue. Here, I want to see a relative strength line that is upward-sloping over
the previous eight to 12 weeks. The formula that I use for the RS line is:
Today’s
stock price
——————-
Today’s
S&P 500 price
The third component that
I need to see is a base, given the fact that most big winners in the stock
market begin their advance after a period of base-building. In general, a base
can be defined as a sideways price movement with a duration of at least five
weeks. A sideways price movement that’s less than five weeks really isn’t a
base, in my opinion. In fact, the longer the base, the better. Or, as the saying
goes, “The bigger the base, the higher they race.”
Bases come in all sorts
of shapes and sizes. Like snowflakes, each has its own subtle nuances. Cups,
cup-with-handles, double bottoms, and flat bases are some of the more common
patterns. Our daily screen, Stocks
Building a Base, is designed to highlight a batch of names that are
in the base-building process. In most all cases, the stock will be in the upper
half of its base, not far from its recent high, which many traders will use as a
pivot point, or point of entry. It is this point that offers the so-called path
of least resistance.
On a weekly basis, I look
at a few thousand stock charts. In addition to giving me a watch list of buy
candidates, this exercise affords me a look at the overall market that I can’t
get from any other indicator or system. I supplement this weekly chart scan with
a daily look at the Stocks
Building A Base
screen, among a few other screens.
Different traders will
have different ways of integrating this screen into their daily regimen of
preparing to do battle with the market. To give you an example of how I use this
screen, I took a look at the April 26, 2000 output, a portion of which I’ve
included below.
Â
| Symbol | Stock Name |
Sub Sector |
| BXP | BostonProperties,Inc. | RealEstateOperations |
| AEE | AmerenCorporation | ElectricUtilities |
| TE | TECOEnergy,Inc. | ElectricUtilities |
| EQR | EquityResidentialProp. | RealEstateOperations |
| KSE | KeySpanCorporation | NaturalGasUtilities |
| EOP | EquityOfficeProperties | RealEstateOperations |
| PSS | PaylessShoesourceHldgs. | Retail(Apparel) |
| SO | SouthernCompany,The | ElectricUtilities |
| D | DominionResources | ElectricUtilities |
| PDCO | PattersonDentalCompany | MedicalEquipment&Supplies |
| PSD | PugetSoundEnergy,Inc. | ElectricUtilities |
| CHA | ChampionInt’lCorp. | Paper&PaperProducts |
| KBL | KeeblerFoodsCompany | FoodProcessing |
| LGE | LG&EEnergyCorp. | ElectricUtilities |
| RDN | RadianGroup,Inc. | Insurance(Prop.&Casualty) |
| AFL | AFLACInc. | Insurance(Accident&Health) |
| BTH | BlythIndustries,Inc. | Personal&HouseholdProds. |
| MCN | MCNEnergyGroup,Inc. | NaturalGasUtilities |
| CINF | CincinnatiFinancialCorp | Insurance(Prop.&Casualty) |
| CP | CanadianPacificLimited | Conglomerates |
| DUK | DukeEnergyCorporation | ElectricUtilities |
| LLY | EliLilly&Co. | MajorDrugs |
| SCZ | SecurityCapitalGroup | RealEstateOperations |
| STR | QuestarCorporation | NaturalGasUtilities |
| OAT | QuakerOatsCompany | FoodProcessing |
| PLD | ProLogis | RealEstateOperations |
| CYN | CityNationalCorporation | RegionalBanks |
| PHM | PulteCorporation | ConstructionServices |
| AHC | AmeradaHessCorporation | Oil&Gas-Integrated |
| DST | DSTSystems,Inc. | ComputerServices |
| NNS | NewportNewsShipbuilding | WaterTransportation |
| UCM | UnicomCorporation | ElectricUtilities |
| EPG | ElPasoEnergyCorp. | NaturalGasUtilities |
| SYY | SyscoCorporation | FoodProcessing |
| CG | ColumbiaEnergyGroup | NaturalGasUtilities |
| PEP | PepsiCo,Inc. | Beverages(Non-Alcoholic) |
| DPH | DelphiAutomotiveSystems | Auto&TruckParts |
| LRY | LibertyPropertyTrust | RealEstateOperations |
| AES | AESCorporation,The | ElectricUtilities |
| PPE | ParkPlaceEntertainment | Casinos&Gaming |
| ELY | CallawayGolfCompany | RecreationalProducts |
| GDW | GoldenWestFinancial | S&Ls/SavingsBanks |
| AGN | Allergan,Inc. | Biotechnology&Drugs |
| BAX | BaxterInternationalInc. | MedicalEquipment&Supplies |
| LUV | SouthwestAirlinesCo. | Airline |
| CHRW | C.H.RobinsonWorldwide | Misc.Transportation |
| FDC | FirstDataCorporation | ComputerServices |
| MUR | MurphyOilCorp. | Oil&GasOperations |
| SLB | SchlumbergerLtd. | OilWellServices&Equipment |
| MAN | ManpowerInc. | BusinessServices |
| EDS | ElectronicDataSystems | ComputerServices |
| IRF | InternationalRectifier | Semiconductors |
| PLL | PallCorporation | Scientific&TechnicalInstr. |
| AXP | AmericanExpressCompany | ConsumerFinancialServices |
| NLCS | NationalComputerSystems | ComputerPeripherals |
| SBH | SmithklineBeecham | MajorDrugs |
| W | WestvacoCorporation | Paper&PaperProducts |
| EXPD | ExpeditorsInt’lofWA | Misc.Transportation |
| HWP | Hewlett-PackardCompany | ComputerHardware |
| XOM | ExxonMobilCorporation | Oil&Gas-Integrated |
| GTE | GTECorporation | CommunicationsServices |
| CZN | CitizensUtilitiesCo. | CommunicationsServices |
Since I almost always
limit my focus to groups showing dynamic earnings and/or revenue growth, the
first thing I do with this screen is filter out those names associated with
slow-growth or stagnant industries. That means ignoring groups like real estate
operations and utilities, among others. Like so many other traders of all
timeframes, I’m especially searching for computer-related groups. My preliminary
screen, then, eliminates the groups that I deem undesirable, and produces the
following sublist of the above list:
| PSS | Payless Shoesource Holdings |
Retail (Apparel) |
| PDCO | Patterson Dental Company |
Medical Equipment & Supplies |
| BTH | Blyth Industries | Personal & Household Products |
| LLY | Eli Lilly & Co. |
Major Drugs |
| DST | DST Systems | Computer Services |
| PEP | PepsiCo | Beverages (Non-Alcoholic) |
| PPE | Park Place Entertainment |
Casinos & Gaming |
| ELY | Callaway Golf | Recreational Products |
| AGN | Allergan | Biotech & Drugs |
| BAX | Baxter International |
Medical Equipment & Supplies |
| FDC | First Data Corp | Computer Services |
| MAN | Manpower Inc | Business Services |
| EDS | Electronic Data Systems |
Computer Services |
| IRF | International Rectifier |
Semiconductors |
| NLCS | National Computer Systems |
Computer Peripherals |
| SBH | SmithKlineBeecham | Major Drugs |
| HWP | Hewlett-Packard | Computer Hardware |
| GTE | GTE Corp | Communications Services |
Â
My next filter requires
projected earnings growth of at least 30%-40% a year over the next one or two
fiscal years. You can find Wall Street consensus earnings estimates on a variety
of Web sites. They’re available on the TradingMarkets.com site by clicking on
the “Z” column of the Stocks
Building A Base
screen. That accesses the Zack’s database of earnings estimates.
One by one, I check each
of the companies on the above list for earnings growth. All fall shy of my
30%-40% minimum target except one: International Rectifier (IRF). Wall Street
expects the company to grow earnings by 858% and 87%, respectively, for 2000 and
2001. This is the exact type of dynamic growth I’m looking for. It’s a member of
the semiconductor manufacturing group, one of the top three segments in the
entire market. I then move to my relative strength test, something I verify on
another software package. It passes my test by showing outperformance over the
past 12 weeks. In particular, I note that IRF has strongly outperformed over the
past two weeks. Looking at a chart, I notice that the stock has climbed to
within the top 8% of its seven-week base.
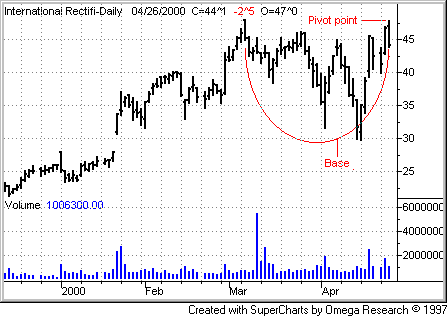
I jot down the price of
the pivot point and add the stock to my quotation screen for monitoring the
following day.
Note: The makeup of the
groups on the Stocks
Building A Base
page will change as the underlying complexion of the general market changes.
For example, immediately following a substantial correction in the technology
sector, there will likely be very few tech issues on this screen, since there
will be few techs building significant bases that are close to their breakout
points. The inclusion of numerous stocks from a particular group on the screen
is a bullish indication for that group.
For The Best Trading
Books, Video Courses and Software To Improve Your Trading
For
more on Kevin N. Marder’s style of intermediate-term trading, see the
Kuhn/Marder
Intermediate-Term trading course.