Long Time
It’s been a REALLY LONG
TIME since the market rallied. So
LONG, in fact, that I believe it’s probably safe to GO LONG following
yesterday’s climactic selling. But
pick your spots carefully.  Â
Sectors have become a very
one-sided affair. They are all in
steep downtrends, and they are all trading below their long-term moving
averages. And with the exception
of the Semiconductor and Biotech ETFs, they all made new, multi-week, if not
multi-month lows on Monday. Even
the previously bulletproof Healthcare
(
$HMO.X |
Quote |
Chart |
News |
PowerRating) and DefenseÂ
(
$DFX.X |
Quote |
Chart |
News |
PowerRating) indexes have crumbled recently. In a perverse way, this is a contrary indication, as it implies there
may finally be too much company on the bear side.Â
Volatility is screaming, too,
with the VIX reaching nearly 50 on Monday. And look at total NYSE volume: Friday
2.6 and Monday 2.2 billion. That’s a few shares. In
fact, it’s exactly the kind of volume one would expect to see during a
selling climax. The NYSE TICK has
recorded sub-negative 1000 readings in eight of the last nine trading days,
with a whopping negative 1465(!) yesterday. That’s
lower than we saw at last September’s bottom. Thus, Monday’s picture certainly has all the earmarks of a climax.
Readers of my nightly service
are still long the Biotech HOLDRs
(
BBH |
Quote |
Chart |
News |
PowerRating) with a tight stop. I’ve also got orders in to buy the
Semiconductor HOLDRs
(
SMH |
Quote |
Chart |
News |
PowerRating) today
if they take out yesterday’s highs. But
these are only trades, and not long-term forecasts. I have definitely not forgotten the bigger picture patterns that led us
to this point.Â
Back in the middle of May I brought
your attention to bearish, multi-month topping patterns in Home Depot
[HD|HD],
General Electric [GE|GE],
Microsoft [MSFT|MSFT],
IBM [IBM|IBM],
Pfizer [PFE|PFE],
Abbott [ABT|ABT],
Citigroup [C|C],
and American International Group [AIG|AIG]. Just for grins, let’s review the
“before” and “after” prices:
|
Symbol
|
17-May
|
22-Jul
|
Change
|
|
HD
|
48
|
28
|
-42%
|
|
GE
|
33
|
25
|
-24%
|
|
MSFT
|
56
|
46
|
-18%
|
|
IBM
|
85
|
68
|
-20%
|
|
PFE
|
37
|
26
|
-30%
|
|
ABT
|
47
|
32
|
-32%
|
|
C
|
47
|
32
|
-32%
|
|
AIG
|
69
|
56
|
-19%
|
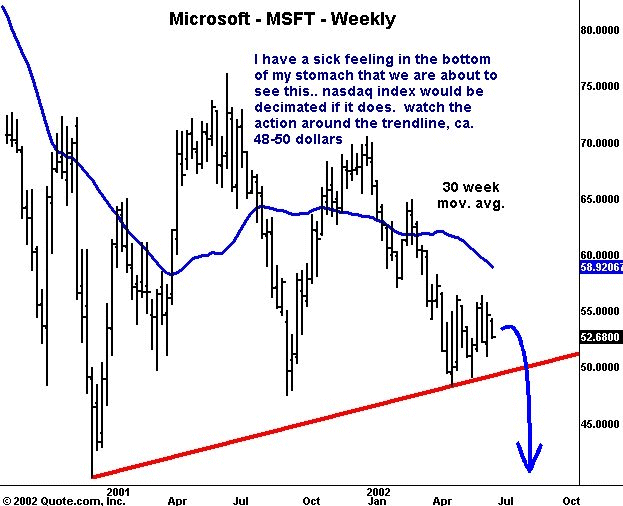
Going back just three weeks
ago, I showed you this chart of Microsoft (MSFT), while the price was
still at 52-53.

The chart pattern suggested
lower prices, and while the road was not a straight one, lower indeed
Microsoft’s price went. Yesterday
MSFT closed at 46.
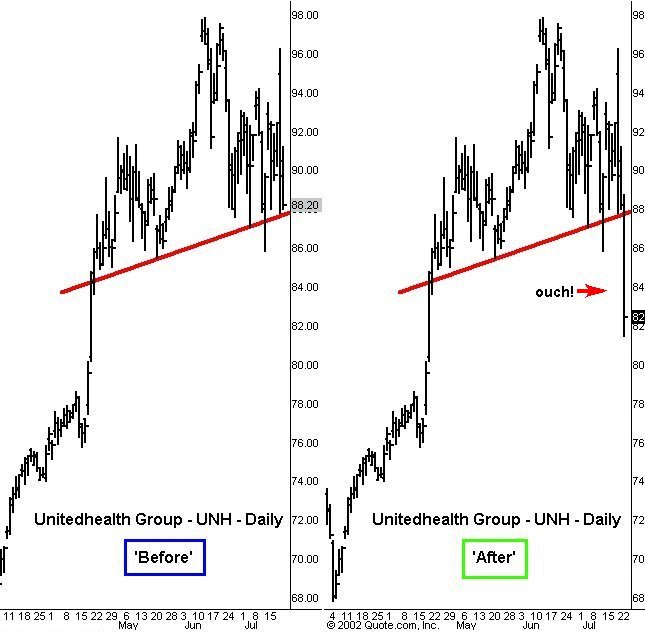
And last week, I alerted my nightly
service readers to the potential head-and-shoulders top pattern in
Unitedhealth Group
(
UNH |
Quote |
Chart |
News |
PowerRating). Here’s
a little “before and after” shot for those who missed it:

Do chart patterns always
work? Hardly. For example,
Orbital Science
(
ORB |
Quote |
Chart |
News |
PowerRating), which I brought
to your attention back on June 28, had what appeared to be a very textbook
head-and-shoulders bottom reversal setup. However, ORB was repelled at neckline
resistance and now trades about
25% lower.Â
One final note. In regard to the potential impact that massive redemptions could have
on mutual fund companies, one of the oldest and most widely followed market
gurus, Richard Russell, was quoted Monday as saying: “I believe we could see
literally the destruction of the mutual fund industry.â€Â While I don’t necessarily subscribe to this extreme vision, it does
raise a question about what might happen to the fund business vis-Ã -vis
Exchange Traded Funds, in the event of a partial meltdown among the
mutual fund companies. My guess
is that ETFs would be the beneficiary, gaining a greater share of the total
investment fund business, as well as increasing ETF liquidity and volume.
Dan
