More Red In Tech ETFs
The pullback in tradable tech funds
deepened Thursday and spread to some of the defensive areas as well. Financials
also took losses, pressured by shares in banks and brokers.
The B2B Internet HOLDR
(
BHH |
Quote |
Chart |
News |
PowerRating) shed
7.4%, the day’s sharpest loss among the Exchange-traded
funds. That decline follows through on a 7.3% loss on Wednesday.

Among the HOLDR’s components, Commerce
One
(
CMRC |
Quote |
Chart |
News |
PowerRating) lost 9.1%, Agile Software
(
AGIL |
Quote |
Chart |
News |
PowerRating) 11.5%, FreeMarkets
(
FMKT |
Quote |
Chart |
News |
PowerRating)
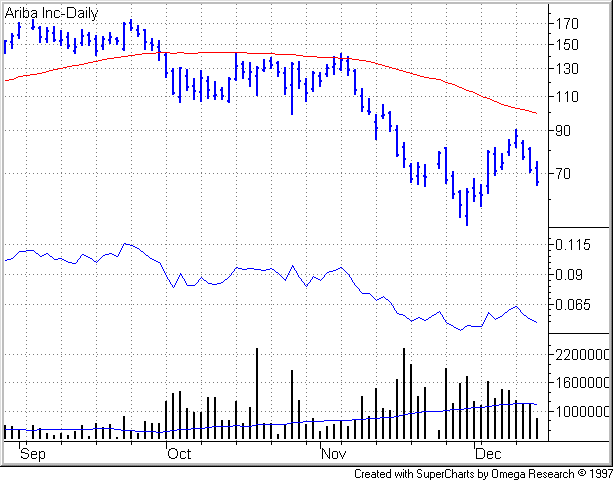
9.0%, Ariba
(
ARBA |
Quote |
Chart |
News |
PowerRating) 6.9%.

The Internet Infrastructure HOLDR
(
IIH |
Quote |
Chart |
News |
PowerRating)
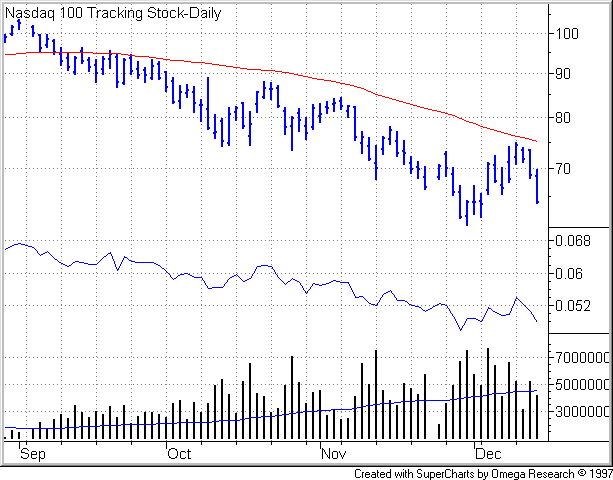
lost 5.8%, the Nasdaq 100 Tracking Stock
(
QQQ |
Quote |
Chart |
News |
PowerRating) 5.5%, the Dow Jones Internet
iShares
(
IYV |
Quote |
Chart |
News |
PowerRating) 3.9%, the Dow Jones Technology iShares
(
IYW |
Quote |
Chart |
News |
PowerRating) 3.0%, the
Broadband HOLDR
(
BDH |
Quote |
Chart |
News |
PowerRating) 2.7%, the Internet HOLDR
(
HHH |
Quote |
Chart |
News |
PowerRating) 2.7%.

Among the rate-sensitive ETFs, the
Financial SPDR
(
XLF |
Quote |
Chart |
News |
PowerRating) 2.8%, the Dow Jones Financial Services iShares
(
IYG |
Quote |
Chart |
News |
PowerRating)
2.7%, the Dow Jones Financial iShares
(
IYF |
Quote |
Chart |
News |
PowerRating) 1.7%, the Banking HOLDR
(
RKH |
Quote |
Chart |
News |
PowerRating)
1.2%.


Energy stocks, and thus energy ETFs, headed
lower with energy prices. The immediate cause appeared to be a resumption of
Iraqi crude exports. The Energy SPDR
(
XLE |
Quote |
Chart |
News |
PowerRating) lost 3.2%, the Dow Jones Energy
iShares
(
IYE |
Quote |
Chart |
News |
PowerRating) 2.7%.

We’re seeing some bearish action in
high relative strength stocks. A number of stocks that last week were setting up
or breaking out have gotten rolled back. For a look at their charts, see my
The News.
The top field of all charts in this
commentary uses a logarithmic price scale and displays a 50-day price average in
red. In the second field, a
blue relative strength line represents the displayed security’s price
performance relative to the S&P 500. The third field displays vertical daily
volume bars in black with a 50-day moving average in blue for volume.
Exchange-traded
funds combine traits
of stocks and mutual funds. Like mutual funds, an ETF represents diversified
ownership in a number of different stocks, greatly reducing company-specific
risk. Like stocks, ETFs trade on exchanges, nearly all of them, in fact, trade on
the American Stock Exchange at present. They quote throughout the day, enabling
traders to take advantage of intraday price moves.
If you’re new to exchange-traded funds,
be sure to visit TradingMarkets’ Knowledge Center,
dedicated to explaining the basics of trading and active investing in ETFs and
mutual funds. Just click on the Funds tab
near the top of this page, then click on the Knowledge
Center tab.Â
You also will find lessons on trading
exchange-traded funds in the Stocks Education area of TradingMarkets.com. In
particular, check out my three-part series on trading ETFs, starting with
Average Crossovers. I also recommend newcomers read my tutorial,
HOLDRs: Unique Opportunity And Risk.
Â
Â