Mountain Of Money Or Mountain Of Lies?
The Nasdaq Composite put in an impressive performance today after shrugging
off big early losses on the heels of an earnings warning by fiber optics darling JDS Uniphase
(
JDSU |
Quote |
Chart |
News |
PowerRating).
We may, in fact, have witnessed the beginnings of a multi-day phenomena in which the Nasdaq Composite and Dow Jones Industrial Average diverge. With
the Philly Semiconductor Index (SOX) lighting a blow torch under the tech sector late morning, the
Dow pleaded “no contest” as the banking,
brokerage, and utility indexes continued to look weak and tired.Â
Let’s take a look at the Nasdaq Composite 60-minute chart and see what’s happening.
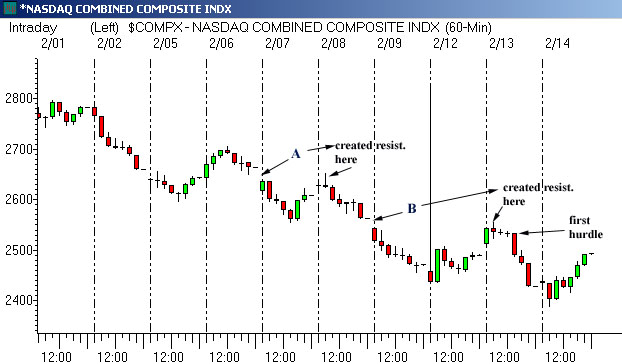
As we can see, the Nasdaq Composite took out the lows of 2/12 today and reversed up to close near its highs. Looking further back, we can see two
potential areas of resistance that have halted prior rally attempts in the past 6 sessions. These areas are indicated on the chart above as points
‘A’ and ‘B’. Each of these points indicate a gap down on the opening of
trading on that day. Point A served as resistance on a rally attempt on 2/08 while point B served as resistance on a rally attempt on 2/13.   At
present, it appears that yesterday’s big red ‘breakdown’ bar which formed following
Greenspan’s congressional testimony will serve as potential resistance with the rally at hand. This level currently stands at 2534.
Looking at a longer range timeframe, let us know examine a weekly chart of the Nasdaq Composite.

An examination of the Nasdaq Composite’s weekly chart shows us that the index found support at its lows today which correspond with a prior support zone
from early January, 2001. As such, if today’s lows hold, the index may be poised to mount yet another rally. However, we can see the many areas of
potential resistance looming above, ready to drop the ACME anvil on the bullish Wylie Coyote’s of the world. For the past two months, the bearish
weekly bar from the second week of December, 2000 has been serving as resistance on any rally attempts. Before we can start believing the second
round of “Nasdaq 3000” calls on the street just because we had a
nice afternoon rally, we will need to see a broad based advance in the index which
can take out prior resistance areas.Â
Will the rally succeed this time? History of the past 11 months has shown each rally attempt failing and the Nasdaq eventually making new lows. Unfortunately, many momentum traders piled on the long side during each on of those ill fated rallies on the promise of a ‘new bull market’ and
the “mountain of money on the sidelines that must go to work.” Remember the
story? Remember the words of our helpful analysts and commentators on CNBC
tell us that “portfolio managers don’t get paid for staying in cash.”Â
Very interesting. What do they get paid for, losing money? Has this
“mountain
of money” really only been a mountain of lies?
Let’s also look at my well-publicized
foe, Philip Morris
(
MO |
Quote |
Chart |
News |
PowerRating).
To thong or not to thong, that is the question…
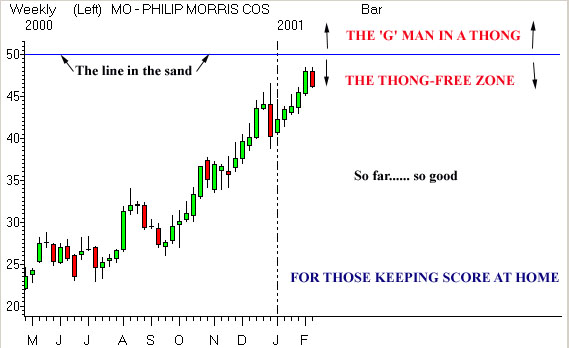
At present, MO might have experienced a severe chink in its armor today as it shed nearly 3%. Looks like a pullback to the 40-42 area is in the cards
over the next month.Â
Long Watch:Â [ JDSU|JDSU],
(
NEWP |
Quote |
Chart |
News |
PowerRating),
(
CIEN |
Quote |
Chart |
News |
PowerRating) and other fibers were on fire today.Â
Look for continuation. The semiconductor and capital equipment group may also continue
to add to today’s gains on the heels of a sector wide upgrade early this morning.
Short Watch:Â Dow components, banks, brokers, drugs all looked weak.Â
(
PVN |
Quote |
Chart |
News |
PowerRating) and
(
COF |
Quote |
Chart |
News |
PowerRating) look very vulnerable.Â
Happy Valentine’s Day,
Goran