Nothing’s Easy
Friday’s rally occurred on both healthy upside
vs. downside volume (16:1) and price momentum in the broad indexes (3%-5%
gains). Due to the longer-term trends, which remain down, we came into Monday
with short-term overbought “Stoch-Trap” conditions in numerous sectors such as
the
(
SPY |
Quote |
Chart |
News |
PowerRating),
(
QQQ |
Quote |
Chart |
News |
PowerRating),
(
SMH |
Quote |
Chart |
News |
PowerRating),
(
OIH |
Quote |
Chart |
News |
PowerRating) and others.
For daytraders, the correct play coming
into the Monday was to look for morning shorts, which was a rewarding strategy
as Gold
(
$XAU |
Quote |
Chart |
News |
PowerRating),
Healthcare
(
$HMO |
Quote |
Chart |
News |
PowerRating) and Materials SPDRs
(
XLB |
Quote |
Chart |
News |
PowerRating) were the only sectors I follow finishing in the plus column.Â
Personally I decided not to chase these short-term indications. Based on last
week’s generally constructive action, I suspect we may (repeat, may) be
forming a cyclical low in the market, and want to give the benefit of the doubt
to the long side. I am watching closely how the market acts on pullbacks. A
higher low above the July 3 low, on relatively mild volume, is what I’m looking
for. So far so good. Yesterday’s decline took place on below-average volume, and
without much gusto.
I have no open positions in my
daily service, and no confirmed trade setups coming into Monday or Tuesday.
I am looking for a successful test of the July 3 lows, and for the right spot to
launch new longs. Resistance is defined by Friday’s highs.
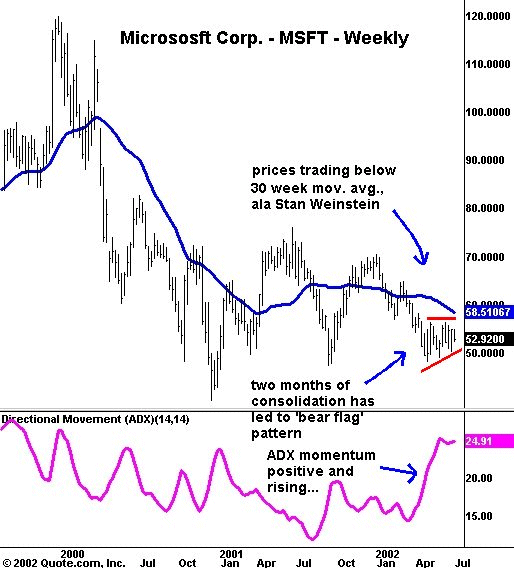
Lastly, in the bugaboo department, I want to leave you with a chart very similar
to one I posted here
a week ago. It’s a weekly chart of Microsoft
(
MSFT |
Quote |
Chart |
News |
PowerRating). As most of you know, MSFT is the largest single component in the
Nasdaq100
(
QQQ |
Quote |
Chart |
News |
PowerRating). Since the Nasdq100 is a cap-weighted index, MSFT exerts a
very large influence over the direction of the index.
The weekly chart below shows some fairly ominous-looking technical
patterns. Prices are below a declining 30-week moving average (read Stan
Weinstein’s “Secrets for Profiting in Bull and Bear Markets”); ADX momentum has
been positive and rising; and the consolidation of the last two months has
formed what could be construed as a bear flag pattern in the weekly chart. The
downside target for this pattern, should it be realized, is $30. More
importantly, the Nasdaq100 would take a serious body blow if MSFT falls.

Â
Hence my title
today: “Nothing’s Easy.”
DanÂ
