Quality Not Quantity
There are very few truly “good” setups out there. For the moment,
I’m focusing on moves (and failed moves) across diagonal trendlines. Usually, I
focus on horizontal trends, but there are not many setups with these types of
trends due to the extreme jigginess of the market.Â
Tech in general is quite volatile, in part because of the low volume. Do not
forget to look at all sectors and groups, from oil service to drugs to fiber
optics. Go where the action is. If you trade for a living, then you know the
value of find quality setups.
Today’s Watchlist:Â Â
(
BAX |
Quote |
Chart |
News |
PowerRating),
(
SUNW |
Quote |
Chart |
News |
PowerRating),
(
ZOMX |
Quote |
Chart |
News |
PowerRating),
(
TLAB |
Quote |
Chart |
News |
PowerRating)
The green line on the charts is the 200-day MA and the blue
line is the 50-day MA.
Baxter International
(
BAX |
Quote |
Chart |
News |
PowerRating)
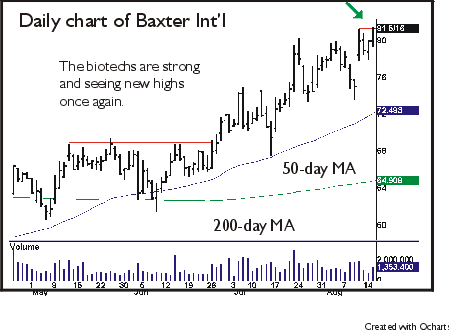
is a generic drug making company. Baxter set a new high on Tuesday after pulling
back for only two days. The volume was reasonable, but again, nothing
spectacular. The drugs have not been strong lately, but biotech has been, and
sometimes the two get lumped together. In a pullback, look for some minor
support near 80. It would be really nice to see a two to four million share day
on the next breakout.

Sun Microsystems
(
SUNW |
Quote |
Chart |
News |
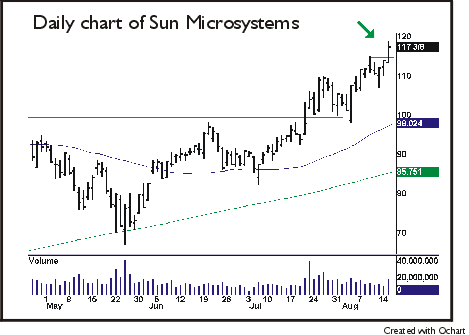
PowerRating) just will not die. The stock is
moving on positive technical and fundamental factors. After an analyst’s call on
Tuesday, the stock surged higher again. The new high close set it up for another
continuation move. Set your alerts near Tuesday’s intraday high and prepare for
another leg higher. I remind everyone again that we have seen numerous failed
continuations following even the strongest of breakouts, so tighten your stops.
The volume was nothing to write home about, but it was stronger than average,
which is something.

Zomax
(
ZOMX |
Quote |
Chart |
News |
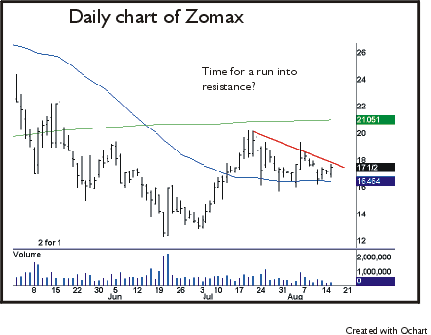
PowerRating) is an example of a potential failed move over
a trendline. Except for one intraday price anomaly, the stock has been in a
near-term downtrend. Watch for a run into resistance, which is roughly near
18. Look for a failed move to result in another pullback to the 50-day MA. If
ZOMX takes out the 50-day MA, it may complete a descending-triangle formation
and provide a second short opportunity.Â

Tellabs
(
TLAB |
Quote |
Chart |
News |
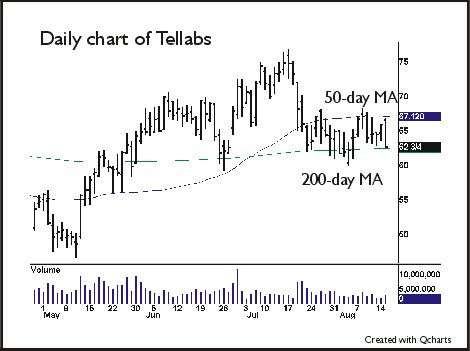
PowerRating) is stuck between the 50-day MA and the
200-day MA. Watch for a move outside of this trading range to provide a long or
short opportunity. TLAB closed on the 200-day MA after almost touching the
50-day MA intraday. The volume has been relatively consistent during this
congestion. In the bigger picture, if it breaks out and then fails again, it may
form a head-and-shoulders pattern on the daily charts between May and August.

Until later,Â
Check back at 2:00PM ET
for Trading the Techs PM.
