Relative Strength Review
In my
June 25 column, “Ratio Watch,”
I showed how the relative strength line between the
Nasdaq 100
(
$NDX |
Quote |
Chart |
News |
PowerRating) and S&P 500
(
$SPX |
Quote |
Chart |
News |
PowerRating) indexes had been leading the market lower over the past several
months. The ratio back then was 1.05, lower than at its lowest point at the
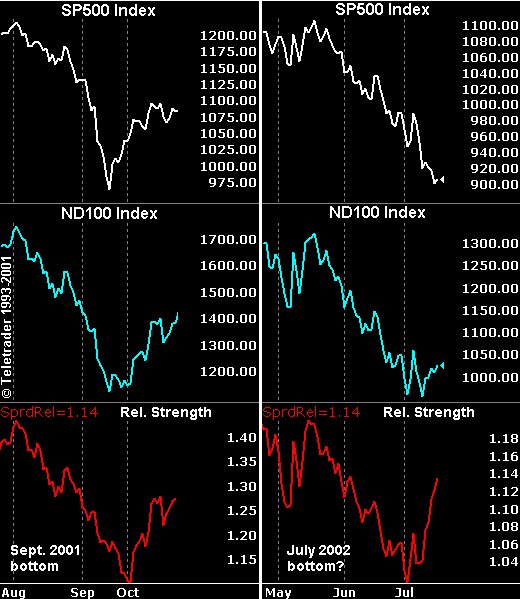
September/October 2001 bottom.Â
Consequently, the market continued to slide lower. However, over the past few
weeks, we’ve seen a noticeable increase in the relative strength line. The
current jump in Nasdaq 100 strength relative to the S&P 500 is similar to the
jump we saw at the bottom in September/October of last year. See chart
comparison.
We’ll have to wait
and see whether the general market responds to this normally leading
indication, or whether the force of the bear trend is so great that the pick
up in relative strength represents only a pause before the market sinks
again.Â
Some of the sentiment indicators this week have pointed to increased fear and
anxiety, with large readings in the VIX
(
$VIX |
Quote |
Chart |
News |
PowerRating),
TICK, and total NYSE volume. These are normally bullish contra indicators.
Noticeably absent however has been the market’s ability to mount any kind of
significant price or breadth surge. Also still on my mind is the ability of
Microsoft
(
MSFT |
Quote |
Chart |
News |
PowerRating) to defend the 48-50
level.Â
Primarily, it’s
been the Biotech
(
BBH |
Quote |
Chart |
News |
PowerRating) and
Semiconductors
(
SMH |
Quote |
Chart |
News |
PowerRating) sectors that have
fueled the Nasdaq’s recent relative strength gains. Other sectors have not yet
responded to the market’s oversold conditions.
Earlier this week
we got stopped out of our two long trades, in the SPY and the QQQ. Currently
we are long the BBH and the DIA with tight stops.