Selecting And Trading Turnaround Stocks
I confine most of my long trades to
stocks with track records of stellar earnings growth. This
discipline has paid off for many an intermediate-term momentum trader. However,
I part from the script for two special situations.
Exception #1: The company underlying the target stock undergoes a positive turnaround in its corporate performance, or its industry
is staging a recovery. I will teach you how to trade Exception #1 stocks in this lesson.
Exception #2: Wall Street expects the company to deliver robust earnings growth over the next two years
as reflected in the consensus analyst estimates compiled by Zacks or First Call.
Portfolio manager Kevin Marder screens for companies meeting this criterion. Kevin describes this approach in the Kuhn/Marder
Intermediate-Term Momentum Trading Course, available for free through
the TradingMarkets home page to one- and two-year members.*
Most turnarounds
happen in cyclical industries, groups that undergo boom/bust cycles in
anticipation of future economic expansions and contractions. When they reverse to the upside or downside, they
usually do so even more in advance of their fundamentals than do other stocks. The intermediate-term trader typically steers clear of the deep cyclicals because they trend
poorly. Rather than breaking out and running up long winning streaks, the
cyclicals often are bound within large ranges. The optimal hunting ground for the I-T trader is growth.
Semiconductors
One vital area of
the economy displays both growth and cyclical characteristics — manufacturers of semiconductors and of the equipment that makes semiconductors. When these stocks break out of sound bases, they can
act like growth stocks, launching into ascents that carry them far into
new high ground. However, they also possess the cyclical characteristic of
beginning such runs long before profit growth lies on the table.
So how do we as intermediate-term
momentum traders get a piece of this action? Above all, insist on the same
technical standards that you do in your growth stocks. The stock should have
established a clear price uptrend above its 50- and 200-day moving averages. The
fast moving average should appear above the slow moving average on the chart.
The stock should emerge from a sound base. The share price should be close to
making a new all-time or 52-week high.
I also would modify two technical
criteria.
First, rather than accepting 12-month
or six-month relative strength scores of 80 or higher, I would move up the RS to
a minimum of 90.** Because the earnings and sales picture is often cloudy for
these stocks when they break out, you want even more evidence that the stock
market has signed on for the ride.
Second, these stocks can undergo more
volatility than do growth stocks on breakout. So I sometimes will give a semiconductor stock
more room to move around by setting an initial price stop lower than my norm.
This means using a volatility-adjusted price stop. If I’m playing a breakout
from a cup-with-handle or W-with handle, I will set my stop just below the low of the handle
rather than using a fixed percentage stop.
Don’t let this allowance lead you into excessive risk. The more you let a stock move against you, the more you should reduce your position size in that stock, thus holding constant the risk to your total account equity. For more on
combining stops with position sizing, see my lesson,
Risky Business.
Bottom Feeding
For the intermediate-term momentum trader, playing a turnaround means entering a stock later in its move off the lows than, say, value investors. Let the bottom feeders take the risk of arresting a stock’s decline by stepping in and buying. We enter the turnaround game only after our target stocks have established fresh uptrends and built up a nice head of momentum steam.
The Nasdaq bear of
2000-2001 inflicted a drastic valuation contraction on chip
stocks like Intel
(
INTC |
Quote |
Chart |
News |
PowerRating), Motorola
(
MOT |
Quote |
Chart |
News |
PowerRating), Texas Instruments
(
TXN |
Quote |
Chart |
News |
PowerRating)
and TriQuint Semiconductor
(
TQNT |
Quote |
Chart |
News |
PowerRating) and on chip-equipment stocks like Applied Materials
(
AMAT |
Quote |
Chart |
News |
PowerRating), KLA-Tencor
(
KLAC |
Quote |
Chart |
News |
PowerRating) and Novellus
(
NVLS |
Quote |
Chart |
News |
PowerRating). Then Wall Street heaped on even more abuse as it discounted
the possibility of recession and slump in demand for chips and chip gear.
At the time that I’m writing this
lesson (late April 2001), semiconductor stocks appear to have put in a bottom. In early April, the semis rebounded off the lows on huge volume spikes and followed through with gap-up price moves. These signals indicate a surge in net buying by mutual funds, pension funds, insurers and other institutional
investors.
The news media and semi analysts are debating whether the
industry is primed for a comeback. Much ado was made over Intel’s announcement
reaffirming its original capital expenditure budget for 2001. Never mind that Texas
Instruments slashed its 2001 capital budget to $1.8 billion with half of that sum
already spent in the first quarter!
And never mind that new orders for chip gear plunged last month. Semiconductor Equipment and Materials International recently reported that the March 2001 book-to-bill ratio came in at 0.64, its lowest level since September 1998.***
A book-to-bill ratio below 1.0 means new orders are falling below shipment levels. That portends declining revenues ahead. Broadly speaking, I would want a ratio of greater than 1.0 before buying a semiconductor stock. However, never forget that the market is a future-looking discounting mechanism. It could look past even the leading indicators. If the semis were to establish valid chart patterns preceded by price advances lasting weeks to months in duration, I might still buy on the breakouts.
I am not an analyst. I’m a trader. I
do not predict the future, I try to recognize
the present. My economic work serves only to help me make sense of the stock market. If I form an opinion, and the market turns against me, I will abandon that opinion in a flash. I care about making money and minimizing losses. I don’t care about having the market validate my ego.
The point here is not whether semis have put in a bottom. The point is, stocks that have suffered markdowns of greater than 50% seldom shoot straight up into new high ground. The reason partly involves overhead resistance.
Many semiconductor shares are in the hands of investors who bought at much higher price levels and are smarting over deep paper losses. Many of these so-called weak holders tend to sell into rallies and end their unhappy experience with their losing investments. These waves of selling can overwhelm new demand, buffeting stocks and blunting their attempts at ascent. Some of these stocks will chew this mountain of overhead supply, but this process normally takes many months if not years. Buying before these stocks recoup at least half their declines and pull above their moving averages can turn your dollars into dead money.
Another problem has to do with something called asymmetrical leverage. A stock that falls 50% in price must rise 100% in price to retrace all the lost ground. So which trip do you think takes longer? Right. A cratering stock usually runs downhill much faster than a recovering stock climbs uphill. Many of the chip stocks have plunged even more than 50%.
There are no certainties in trading, only probabilites. Maybe the chips will deviate from history, double in a few months and march on to new highs. Maybe a pickup in chip and chip-gear orders is right around
the corner (a hypothetical fully at odds with SEMI’s book-to-bill data). Maybe chip prices will stabilize. Maybe pigs will fly. Leave the
talking heads to this kind of conjecture. I know only one thing: The charts show these stocks are nowhere near establishing robust uptrends with relative strength confirmation. Even if they did form bullish patterns now, the price trends are not in place. The medium-term trader should stay away.
Damaged Goods
Just look at the charts and the 12-
and six-month StockScanner
RS scores of a few of these stocks as of the close on Friday April 27, 2001.
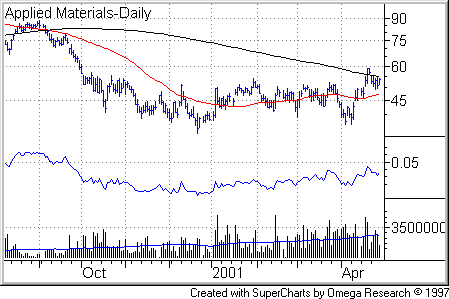
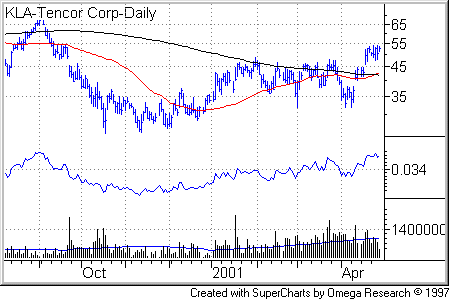
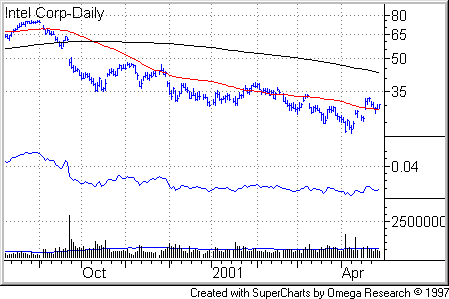
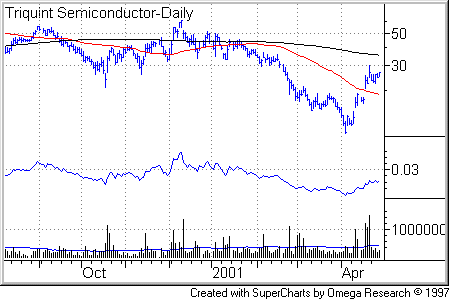
The top field of all stock charts in this
commentary uses a logarithmic price scale and displays a 50-day price average
line in red and a 200-day price average line in black. In the second field, a
blue relative strength line represents the displayed security’s price
performance relative to the S&P 500. The third field displays vertical daily
volume bars in black with a 50-day average line in blue for volume.
Applied Materials
(
AMAT |
Quote |
Chart |
News |
PowerRating),
12-month RS of 18, six-month RS of 54.
KLA-Tencor
(
KLAC |
Quote |
Chart |
News |
PowerRating), 12-month RS of
48, six-month RS of 89.
Intel
(
INTC |
Quote |
Chart |
News |
PowerRating), 12-month RS of 8,
six-month of 13.
TriQuint Semiconductor
(
TQNT |
Quote |
Chart |
News |
PowerRating),
12-month RS of 7, six-month RS of 87.
What can you say about the above?
Three out of four are still trading below their 200-day moving averages with
moving averages inverted (200 over 50). The same three have sideways-to-downward
sloping relative strength lines. KLA-Tencor stands as the exception. Its 50-day
moving average just barely surmounted the 200-day on Wednesday. That’s only
three days of proper moving average order. The moving averages should be in
proper order for the full length of any base. All four stocks are far below
their old highs.
Maybe they constitute credible prospects for swing traders or value investors. The heavy volume shows that powerful institutions are buying these stocks. But to the intermediate-term momentum trader, fooling around with these stocks amounts to buying damaged goods.
It amazes me that some self-described intermediate-term traders are talking up these stocks on the message boards when so many quality stocks in other industries are breaking out under their noses! Over the past two weeks, my daily commentaries have identified a number of setups in entertainment, financial and retail stocks. Many of these names have broken out of
sound bases and headed higher. Where are my stock picks headed in the future? I
haven’t the foggiest. Position management will provide the answers. Buy the best merchandise on breakouts, hold your winning trades and sell your losers.
When you buy stocks for the medium-term trade, go where the strength is now. Don’t try to play the broken-down leaders of the past. Get your eye out of the rear-view mirror and watch the road in front of you!
History
Lesson
Now let’s look at a proper turnaround scenario for the intermediate-term momentum trader. To illustrate, I’ll use the very same stocks. On June 24, 1999, I wrote in
Investor’s Business Daily that the semiconductors were breaking out amid
signs of a recovery in demand for microprocessors and semiconductor-fabrication equipment. How
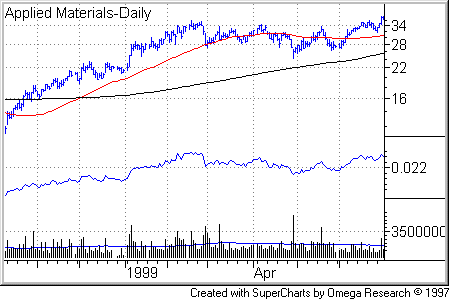
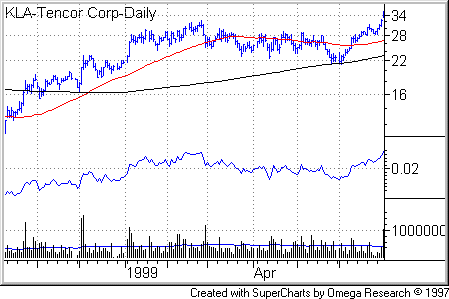
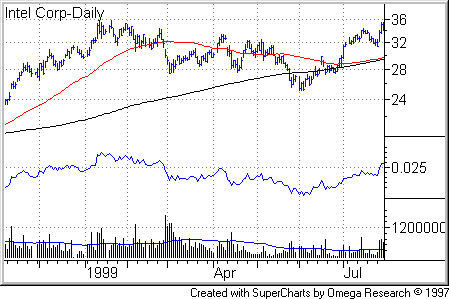
did Applied Materials, KLA-Tencor, Intel and TriQuint look around that time? Eyeball
these charts. The breakouts occurred the day before the last trading session
displayed on each chart.
Applied Materials broke out on June 30, 1999 and vaulted 219% from its pivot point (entry price) to its top on April 7, 2000.
KLA-Tencor gained 212% from June 30, 1999 breakout to April 7, 2000 top.
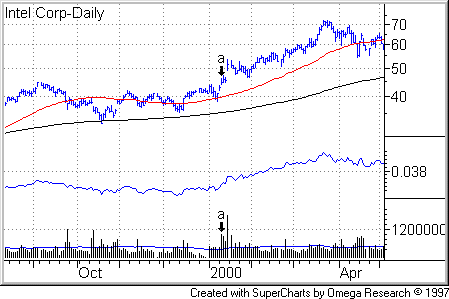
Intel broke out on July 28, 1999 and appreciated 110% to its March 22, 2000 top.
TriQuint broke out on May 18, 1999 and expanded an incredible 1,560% to March 1, 2000 top.
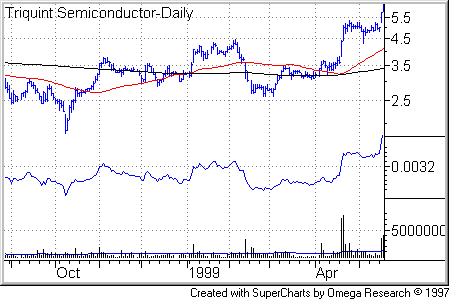
All four were nearing their all-time or 52-week price highs before the last day on the charts. All four
were trading above their 50- and 200-day moving averages, and the moving average
lines were in proper order (50 above 200). Three had upward sloping relative
strength lines that moved near or into new high ground on the breakout. The
exception was Intel, which had a sideways-moving RS line. Intel’s 50-day moving
average came very close to breaching the 200-day, something I generally don’t
like to see. Otherwise these stocks form a bullish picture.
This was early in the 1999-2000 rally
in the semiconductors. The fundamental picture was mixed. Earnings at
Applied Materials, the biggest chip-equipment maker in the world, had declined
20% over the trailing four quarters. But in true cyclical fashion, these stocks
forged ahead from these bases. Meanwhile, the forward-looking indicators portended recovery. Semiconductor Equipment and Materials International had reported a May 2000 book-to-bill ratio of 1.24. The Semiconductor Industry Association forecast global semiconductor sales growth of 12.1% for 1999 vs. an 8% decline in 1998. Intel, the world’s biggest chipmaker, had exhibited top-line recovery. Over the previous five quarters, sales growth had shifted from -7% to 0% to positive rates of 9% to 17% to 18%. In a turnaround situation, revenue revival often precedes resumption of bottom-line growth.
Position Management
Even with precision entries, your stocks can run into some wild and woolly volatility after breaking out. This is especially the case with cyclicals trying to advance while the world is debating whether fundamental improvement is baked into the cake. Winners can run into pullbacks that can trigger percentage stops of 10% or more. As a result, I sometimes use a volatility-based stop. In the case of base-with-handle breakouts, I will set the stop beneath the low of the handle.
How deep below the handle you set
your stop depends on your risk tolerance as defined by your position size and
percentage risk to your total account equity. Sometimes, a breakout stock will
pull back just below the handle low, shaking out shareholders, then resume its
advance. Assuming this pullback does not violate your risk threshold, you can
sometimes hold on, provided you are monitoring the situation. (It should go
without saying, all trades should be monitored
throughout every trading session with a real-time streaming quote service.)
If the stock undercuts the handle low
but does not hit my stop, I go on yellow alert. If the stock continues to trade below the low of
the handle as the market close approaches, I’ll probably exit even if it has not
hit my stop. If it hits my stop, I sell, no ifs, ands or buts. But if the stock pulls above the handle low during the afternoon, I’ll probably stay in,
assuming nothing else about the day’s action scares me out.
To see how this works, let’s zoom in
for a closer look at the Applied Materials breakout.
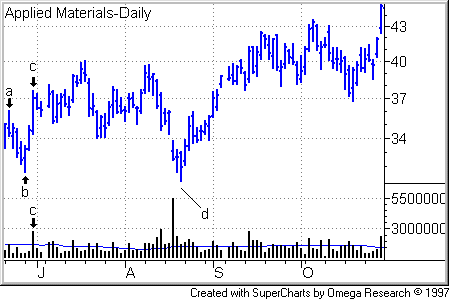
The above chart shows the high of the
handle (see Point a), the low of the handle
(Point b), the breakout on June 30, 1999 (Point
c), then the retest of the low of the handle on Aug. 19 and again on
Aug. 20 (Point d). Notice how on the retest
sessions, the stock breached the handle low but closed above it. From then it
was off to the races.
KLA-Tencor whipsawed after its breakout before barreling higher. The following chart shows the high of the handle (Point a), the low of the handle (Point b), the breakout on June 30 and the pullback low (Point d).
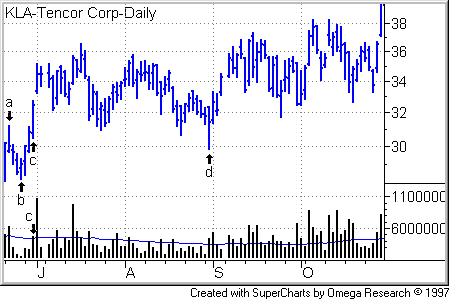
As I said before, these breakouts came
early in the 1999-2000 rally in semis. You don’t have to catch the first move
out of a turnaround in order to get a piece of an authentic rally. If you miss the first wave of breakouts, more stocks will set up downstream. New stocks will break out, and some of the frontrunners will forge ahead, correct well above their previous launching points, then form new setups. Intel provided a case in point. After its July 28 breakout, the chip giant ran up, corrected and formed a new base. The stock gapped out of this second-stage base on Jan. 11, 2000 (Point
a in following chart) on monster volume.
These later breakouts can prove nearly as powerful and less volatile than the frontrunners. Notice how Intel never retested the low of the handle after emerging from its base.
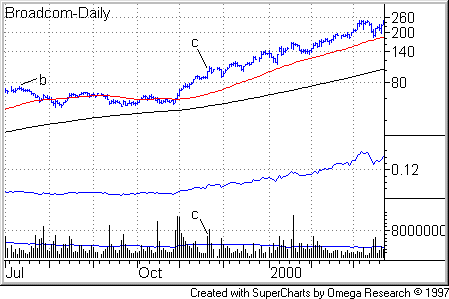
Broadcom
(
BRCM |
Quote |
Chart |
News |
PowerRating), an Irvine, Calif.-maker of chips for broadband applications, broke out of a cup-with-handle pattern on heavy volume on May 11, 1999 (Point
a in following chart). The stock surged 45% over the next nine weeks to peak on July 12 (Point
b).
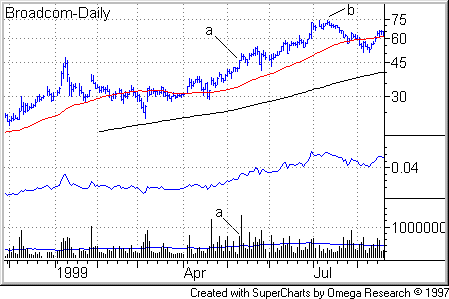
From the July peak, Broadcom shares corrected, recovered and broke out of a new cup-with-high-handle base on Nov. 19, 1999 (Point
c in following chart). From there, the stock nearly tripled in price before topping out in March 2000.
* I have written
my own implementation of the Kuhn/Marder stock-screening protocols for
users of the Telescan ProSearch/WallStreetCity.com database. For these screens and a related article, click this
then click on the link to TradingMarkets lessons.
**Relative strength is a measure of a stock’s price performance relative to all other stocks or an index. The TradingMarkets StockScanner RS scoring system uses a percentile system, updated after each market close. For example, a one-year RS of 90 means that stock has outperformed 90% of all other stocks in the StockScanner database for the past year. A six-month RS of 10 means that stock has lagged 90% of all other stocks in the database over the past six months.
*** You can call up SEMI’s monthly book-to-bill report on the Dismal Scientist website at www.dismal.com, a great source of economics stats and analysis. Click the “go” button next to “view all releases” in the upper left of the home page.
For The Best Trading
Books, Video Courses and Software To Improve Your Trading
