Sell ‘Em Short: Three Patterns For Bears
You can divide short-selling patterns
into two groups:
reversal patterns and continuation patterns. I am going to show
you examples of both.
A reversal
pattern assists you in spotting a major trend change. The
short-seller, of course, is interested in spotting recent leaders right as they
top and break apart. In a continuation
pattern, the short-seller seeks for evidence that a downtrend will continue or
resume, usually after some brief pause.
Head-and-Shoulders
Top
The head-and-shoulders top is the
best-known of the bearish reversal patterns. Individual stocks may form
head-and-shoulders patterns during bull markets, but like any trade, the pattern
works best when the general market is moving in the same direction. In
other words, you run the best chance of profiting from a short-sale when the
market itself is correcting.
In a head-and-shoulders top, an
advancing stock rallies to a first peak, then falls back, forming the left
shoulder. Next, the stock rallies again, this time forming a higher
peak before succumbing a second time. This part forms the head.
Then the stock attempts a final rally, which peaks below the high of the head.
This rally fails, too, forming the right shoulder.
Chart patterns need a pivot
point, a price level which, when pierced,
triggers a buy, sell or short-sell signal. In the head-and-shoulders top, the
pivot point is found by drawing the neckline,
a straight line intersecting the lowest low between (1) left shoulder and the
head and (2) the lowest low between the head and the right shoulder.
When the share
price breaks below the neckline, you short. Of course, always establish an initial
protective stop in any trade, long or short. In
the case of short-selling, your stop will be a price above where you shorted the
stock. Set the price low enough, so if the stock rallies, your sell rule will
require you to buy back the shares and cover your short before your account
sustains a harmful loss.
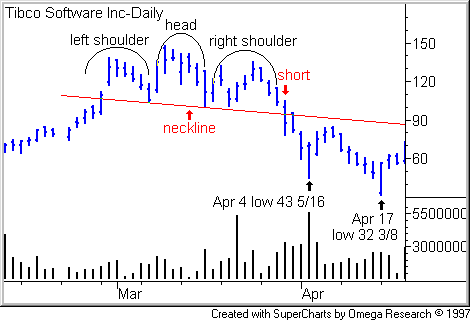
Let’s look at an example. Tibco
completed head-and-shoulders top after the Nasdaq Composite peaked on March 10,
2000, beginning the subsequent bear market.

After an extended advance, Tibco made
an all-time high of 137 15/16 on Feb. 29, then fell to a March 7 low of 104 1/2
before reversing to upside. This first high and low formed the left shoulder.
Then Tibco shares ascended to a March
9 high of 147, then dropped anew to a March 16 low of 101, creating the head.
The stock rallied again, peaking at 135 on March 24 before rolling over.
By now, you would have had neckline
drawn tangent with the March 7 and 16 lows. Tibco shares broke the neckline on
March 30. You would conceivably have shorted the stock at 94 3/8. Share closed
the day at 87 1/2, opened slightly higher the next session but soon succumbed.
Once a successful short has produced a
profit worth safeguarding, I would switch to a trailing stop. Traders using this
technique would have been forced to take a tidy profit on April 4 as the stock
bounced off the low of the session, 43 5/16.
Other traders, looking for a longer
pull, sometimes anticipate a return move, a
rally up to, but not above, the neckline and a subsequent failure to lower lows.
So once a stock declined enough, they would lower their stop to the neckline.
In Tibco’s case, the stock did
initiate a return move, peaking below the neckline at 84 1/2 on April 7 before
rolling over. The stock made a low of 32 3/8 on April 17 before stabilizing.
The Lizard
Jeff Cooper, inventor of the Lizard,
describes it has a “low-risk, potentially high-reward reversal
pattern” in the first of his Hit and Run Trading books. He
uses it for day trading as he has found that has little follow-through power.
Here are the rules for the
short-selling version of the Lizard. (Inversing the rules, you can trade long
off the Lizard.)
1. The stock today must open and close
in the bottom quarter of the session’s trading range.
2. The stock today must make a 10-day
high.
3. Tomorrow sell short if the stock
falls 1/8 point below the prior session low.
4. Maximum risk is 1 point. If you’re
not stopped out, cover your short on the close.
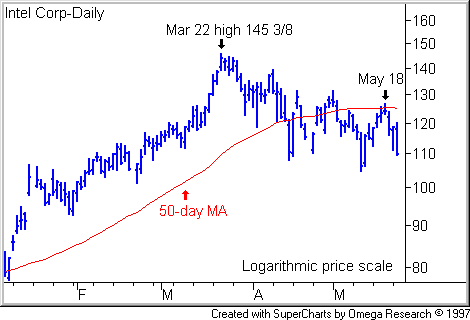
Intel formed a Lizard on May 18, 2000,
then broke lower. Before I show the Lizard in detail, let’s look at a
longer-term view.

As you can see from the above chart,
Intel shares were well into a downtrend by May of that year, and of course, the
market had corrected sharply as well. So you had both the stock’s longer-term
trend as well as the market trend working in favor of the short-seller.
So this particular Intel Lizard is a continuation
Lizard, one which sets up the short-seller to take advantage of the continuing
trend. A short-selling Lizard also can form at tops, which would be an example
of a short-term reversal pattern.

Intel shares made a 10-day new high on
May 18 (see Point A on the chart), an intraday high of 126 1/2, the
stock’s highest level in 12 days. The intraday low was 123 1/8. The day’s
trading range, thus, was 3 3/8 points.
Within that range, the stock opened at
123 7/8 and closed at 123 15/16. So both open and close came in the bottom 25%
of the day’s trading range.
On May 19 (Point B), the stock
dropped 1/8 below the May 18 low of 123 1/8. You would short on the first
subsequent uptick. As you can see, the stock pulled higher, making an intraday
high of 123 5/8. Not enough to trigger your 1-point stop.
If the stock had climbed high enough
to stop you out, don’t give up. If the stock fell anew and triggered a fresh
short signal, short again. As Cooper says: “If things always moved in a
straight line and were pat, we’d all be calling in our trades from the
beach.”
Pullback Shorts
A pullback amounts to a brief pause in
an ongoing trend. Pullbacks can provide profitable entries for buys, when an
advancing stock reverses to the downside before resuming the dominant uptrend,
and for shorts, when a declining stock reverses to the upside before continuing
the downtrend.
TradingMarkets helps you find possible
pullback shorts. Check out the TradingMarkets
Pullbacks
from Lows list, updated after each market close.
A feast time for pullback shorts is
when an entire industry gets decimated from climax highs. In such instances,
fear is running super high, increasing the odds that upside pullbacks are indeed
just pullbacks, not the first steps of a rally.
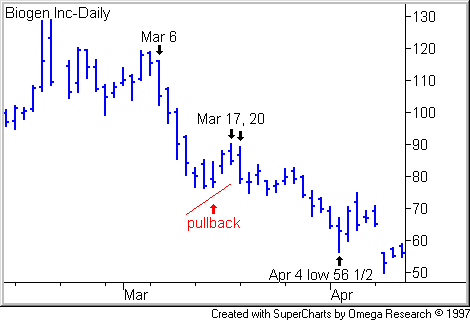
For example, Biogen formed a classic
pullback short in mid March 2000 in the wake of the biotech slaughter which
began the month before.

On Feb. 18, Biogen shares peaked at an
intraday high of 129, then when into a severe markdown that sharpened from March
6. This produced a short-term oversold position, and the stock pulled back.
On March 17, the stock made a pullback
high, then closed poorly, ending the day for a loss, below the open and near the
bottom of the trading range, all signals that pullback had expired, and the
stock was giving up the ghost.
You’d short if the stock fell the next
day below the March 17 low of 87 1/4. As a position trader, I’d set my stop at
90.
Biogen obliged the very next session,
beginning a fresh dive that did not end in a meaningful stand until the share
price hit the April 4 low of 56 1/2.
Dave Landry, an adroit pullback
tactician, focuses purely on price action in pullbacks. For my tastes, I like to
see volume confirmations. Adding volume to the Biogen chart, we can see that
trading activity nicely complemented the story told in the price action.

Notice how volume came in strong
during the sharp decline leading to the pullback, then dropped off fast and
progressively during the pullback. Also, look how the weakest volume in the
pullback coincided with the pullback high.
If the stock’s such a bargain at that
price, where are all the buyers?
